What market conditions are ETF leveraged Tokens suitable for?
Discover ideal market scenarios and strategies for using ETF leveraged tokens effectively.
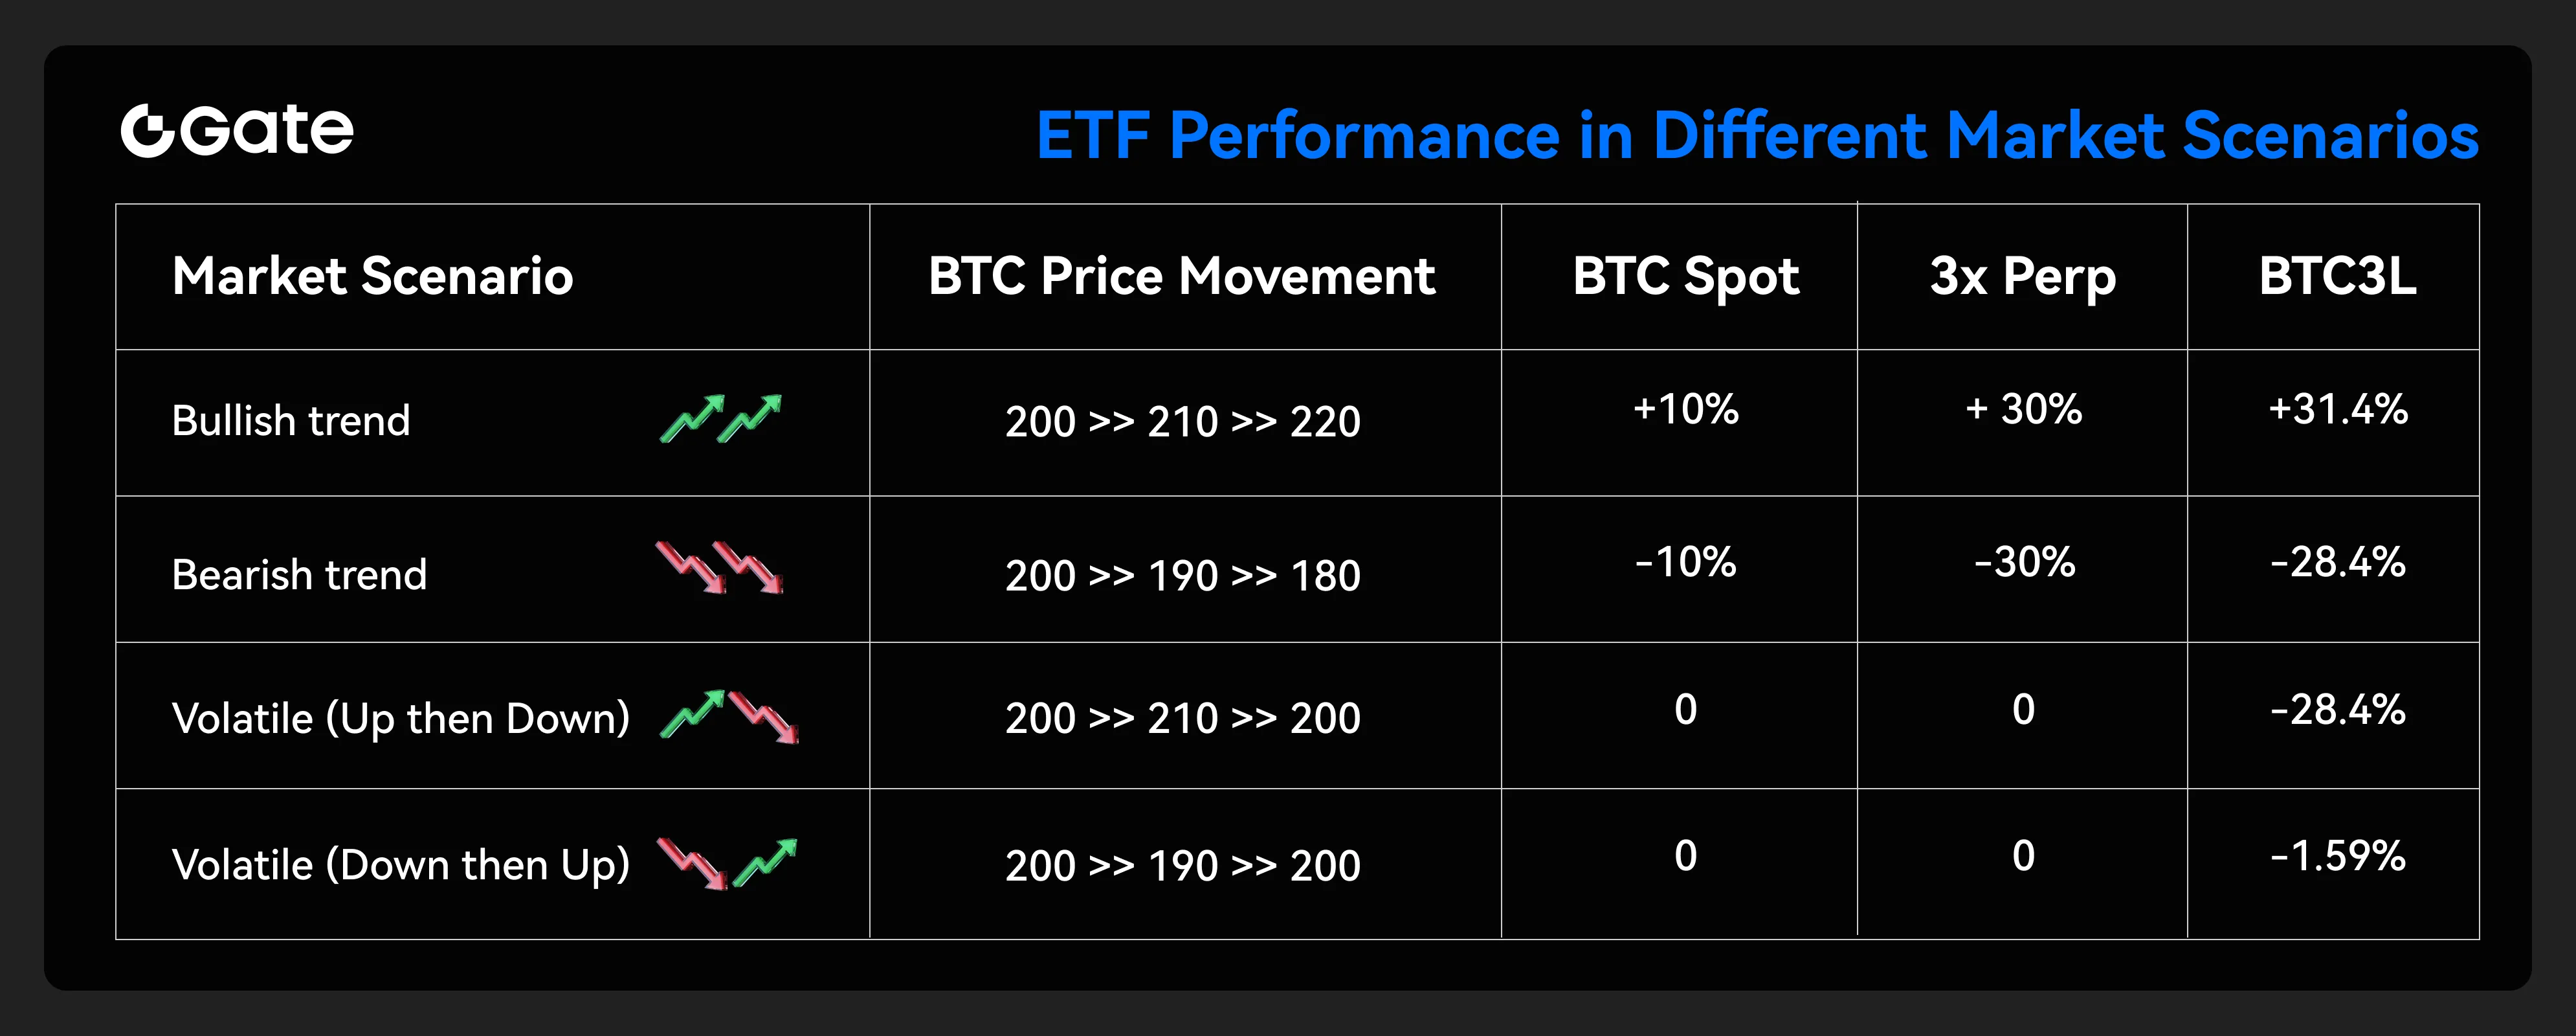
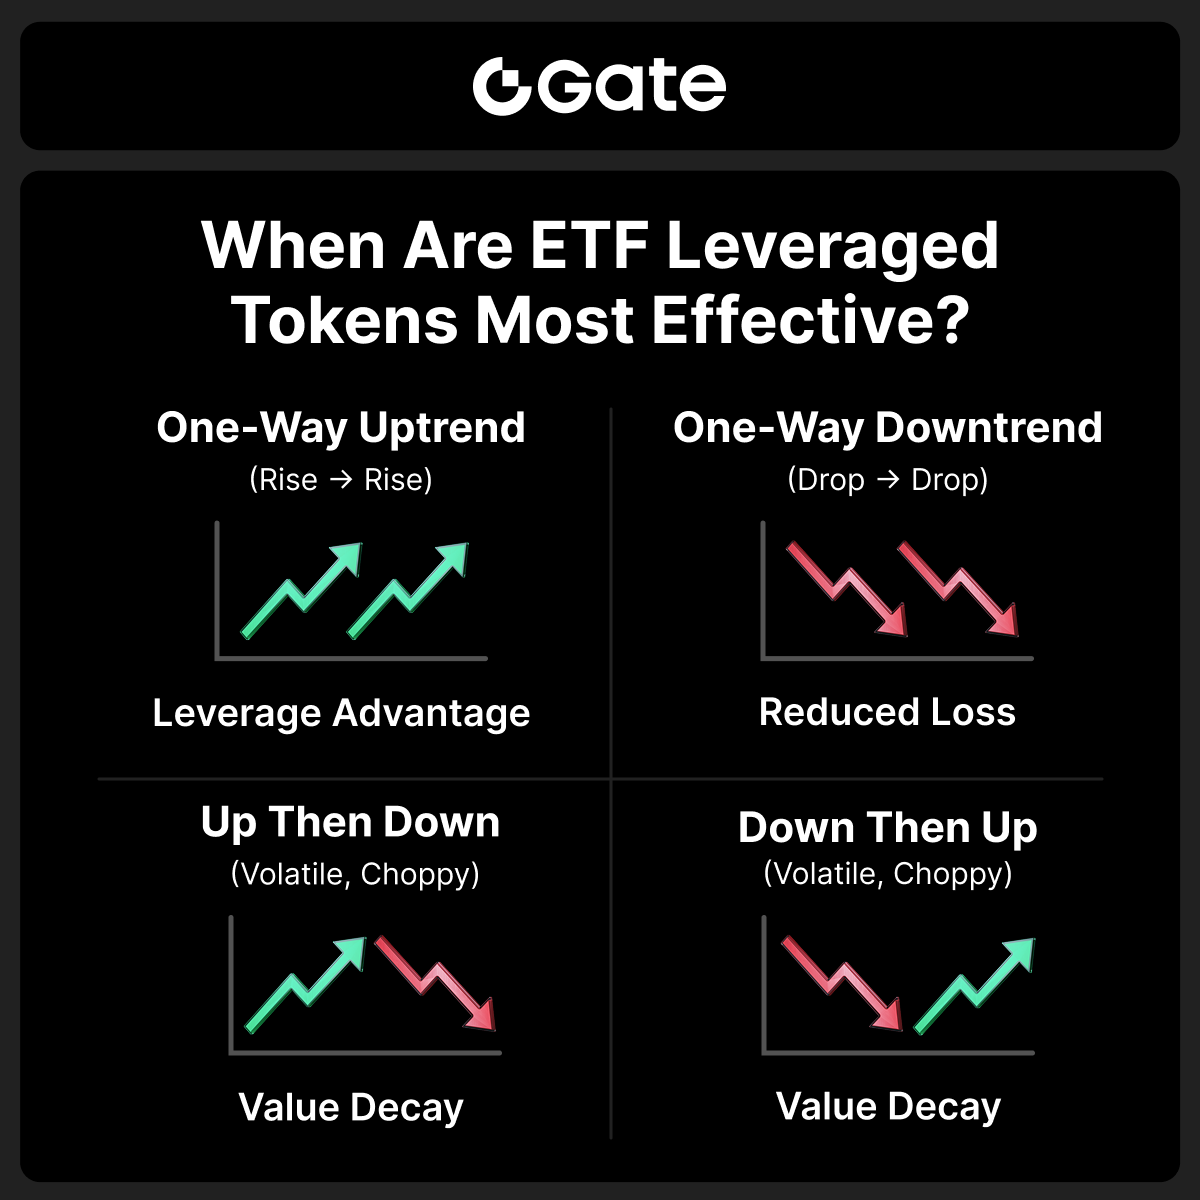
Leveraged ETF products have advantages in one-sided markets. There are more frictional expenses in two-sided markets. Let’s take BTC3L as an example to observe the profitability of leveraged ETF products under different market conditions:
When Are ETF Leveraged Tokens the Better Choice?
✔ In Trending Markets
When you’re bullish on a mid-term trend but worried about short-term pullbacks triggering liquidation in futures positions.
✔ During High Volatility
When the market is highly volatile and you want to avoid the risk of being “liquidated on both sides” in futures long/short positions.
✔ For Position Management
When you want to temporarily reduce your risk exposure while still maintaining market participation.
✔ To Avoid Settlement Risks
When funding rates for perpetual futures are unfavorable, leveraged tokens can be a more cost-effective alternative.
✔ For Beginners in Leverage Trading
When you’re new to leverage trading and prefer a more beginner-friendly tool to gain experience without the risk of liquidation.
When They’re Not Suitable:
⚠️ Sideways/Range-bound Markets
⚠️ Long-term Holding
⚠️ Ultra-high Leverage Requirements
ETF leveraged tokens are ideal for capturing short-term trend opportunities without the risk of forced liquidation. However, in trending markets, value erosion may occur over time due to rebalancing and volatility effects, so position management is essential.
Detailed Example:
(You can add a scenario illustration here — I can help you write that too if you’d like.)
* 3xBTC refers to conventional 3x leveraged BTC_USDT perpetual futures
One-sided market: one way up
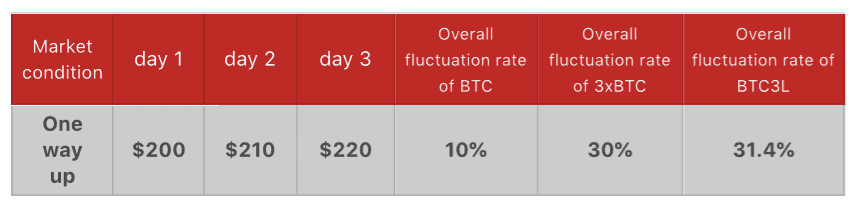
In the “one way up” scenario, leveraged ETF products perform better than conventional 3-time leveraged perpetual futures (3xBTC).
Below is how the profit is calculated: On the first day, the price for one BTC rises from $200 to $210, the fluctuation rate is +5%.
The NAV (net asset value) of BTC3L becomes $200(1+5%× 3)=$230; On the second day, the price for one BTC rises from $210 to $220, the fluctuation rate is +4.76%.
The NAV of BTC3L becomes $230× (1+4.76%× 3)=$262.84; In conclusion, the fluctuation rate in these 2 days is ($262.84 - $200)/$200×100% = 31.4%, which is greater than 30%.
One-sided market: one way down
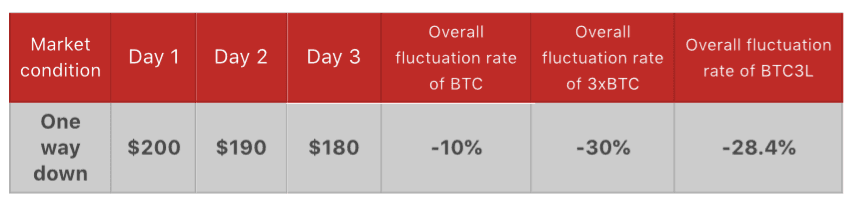
In the “one way down” scenario, the loss incurred from trading leveraged ETF products is less than from futures trading.
Below is how the loss is calculated: The price of BTC falls by 5% on the first day.
The NAV of BTC3L becomes: $200 (1-5%×3)=$170; The price falls again on the second day and the fluctuation rate is -5.26%.
The NAV of BTC3L becomes $170 (1-5.26%×3)=$143.17; The overall fluctuation rate in these 2 days is ($143.17 - $200)/ $200×100%= -28.4%, which is greater than -30%.
Two-sided market: first up, then down
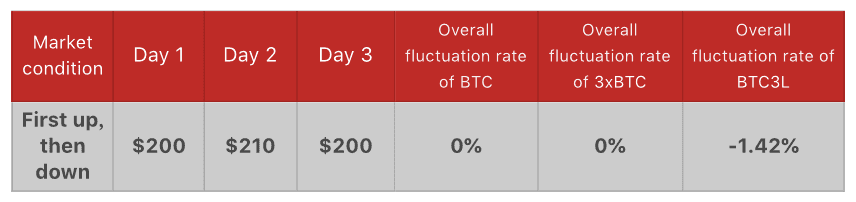
If the price of BTC first rises, then falls back to the same level, then leveraged ETF products do not hold any advantages over perpetual futures.
On the first day, the price for one BTC rises from $200 to $210, the fluctuation rate is +5%. The NAV of BTC3L becomes $200(1+5%×3)=$230;
On the second day, the price falls from $210 back to $200, the fluctuation rate is -4.76%.
The NAV of BTC3L becomes $230(1-4.76%× 3)=$197.16; The overall fluctuation rate in these 2 days is ($197.16 - $200)/ $200× 100%=-1.42%, which is less than 0%.
Two-sided market: first down, then up
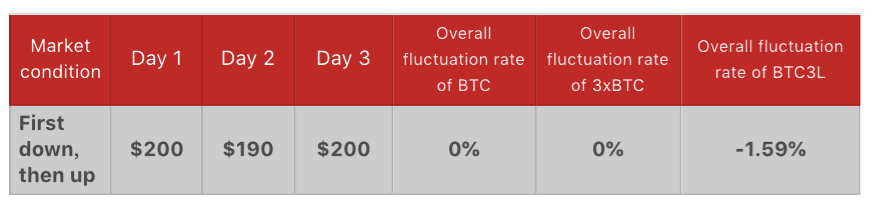
Same as the scenario described above, if the price first goes down, then goes up to exactly the same level, leveraged ETF products are not an ideal investment.
On the first day, the price of BTC falls by 5%.
The NAV of BTC3L becomes $200 (1-5%×3)=$170; On the second day, the price rises back from $190 to $200. The fluctuation rate is +5.26%.
The NAV of BTC3L becomes $170 (1+5.26%× 3)=$196.83; The overall fluctuation rate in these 2 days is ($196.83- $200)/ $200× 100%=-1.59%, which is less than 0%.
Please be warned: Leveraged ETF products are financial derivatives with high risks. This article should only be considered a brief analysis instead of any investment advice. Users must have a thorough understanding of the products and their risks before trading.
Lesson 1:ETF Leveraged Tokens Introduction
Lesson 2:Pros and Cons of ETF Leveraged Tokens
Lesson 3:What market conditions are ETF leveraged Tokens suitable for?
Lesson 4:How Do ETF Leveraged Tokens Differ from Spot, Margin, and Futures Trading?
Lesson 5:How to trade ETF leveraged tokens?
Related courses

Guide to Gate Dual Currency Products
Guide to Gate Dual Currency Products

Tools That Help You Trade Better: Moving Averages, Trend Lines, and Indicators
Tools That Help You Trade Better: Moving Averages, Trend Lines, and Indicators

Technical analysis: A useful tool to understand trends in contract trading
Technical analysis: A useful tool to understand trends in contract trading

Crypto Trade Fundamentals
Crypto Trade Fundamentals

Crypto 101
Crypto 101
