Применение осциллирующего индикатора-KDJ
Этот промежуточный курс "Gate Learn Futures" знакомит с концепциями и использованием различных технических индикаторов, включая графики свечей, технические паттерны, скользящие средние и линии тренда. Эта статья в основном знакомит с применением индикатора колебаний KDJ, интерпретируя состав индикатора, его техническое значение и применение.
Что такое индикатор KDJ?
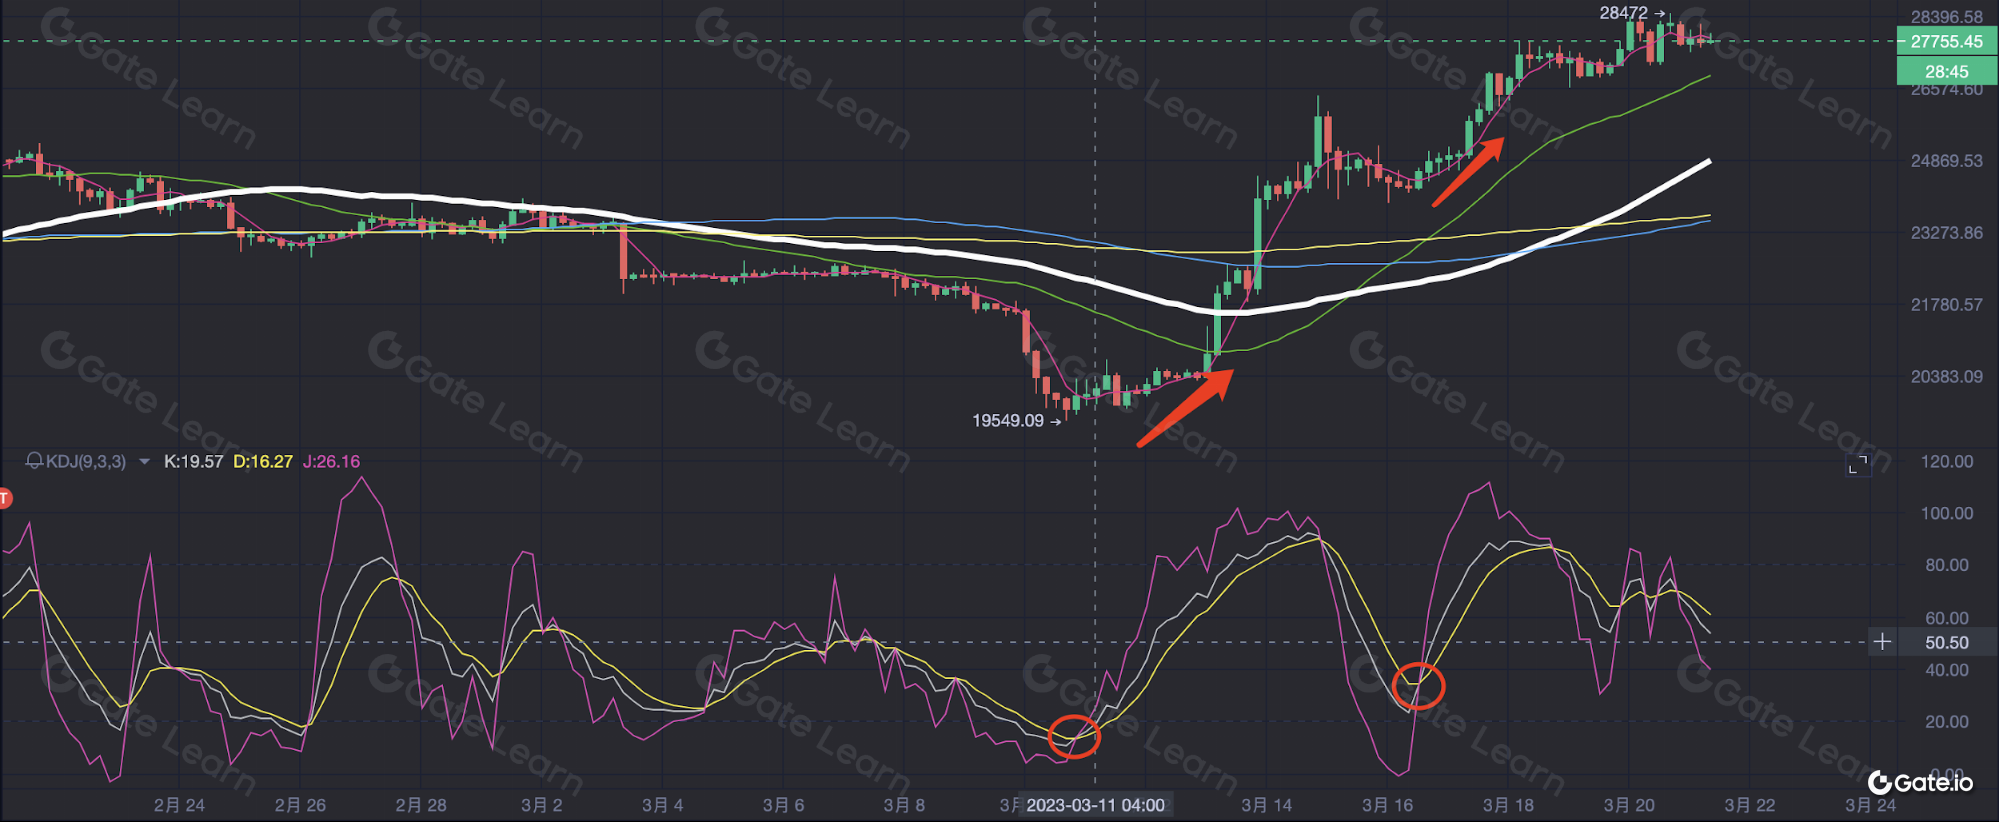
Стохастический осциллятор (KDJ) - это типичный индикатор интервальных колебаний. На рисунке ниже показано, что значение индикатора KDJ колеблется в диапазоне 0-100 и не выходит за пределы этого диапазона. Чаще всего он колеблется в пределах 20-80.

Применение KDJ
Индекс колебаний KDJ эффективен при прогнозировании того, когда цена достигнет вершины или дна. Индикатор колебаний, в сочетании с ценой и объемом торгов, представляет собой три основных элемента, которые трейдеры должны учитывать при оценке состояния рынка. Индикатор работает следующим образом:
Высокое или низкое повешение индикатора - Сигнализирует о том, что индикатор входит в диапазон перекупленности или перепроданности.
Индикатор демонстрирует регулярный цикл изменений - Поскольку индикатор рассчитывается на основе цены, он движется в регулярном цикле, поскольку цена колеблется в соответствии с определенной закономерностью. Например, индикатор будет двигаться волнами, которые достигают более высоких пиков и впадин, чем предыдущая волна в бычьем тренде. И наоборот, на медвежьем рынке каждая волна будет достигать более низких вершин и впадин.
Пересечение линий - Наиболее распространенный вариант использования индикатора предполагает наблюдение за пересечением двух индикаторных линий. Если быстрая линия и медленная линия пересекаются в направлении, направленном вверх, образуется "золотой крест". И наоборот, "крест смерти" образуется, когда две линии пересекаются в нисходящем направлении. Эти два креста также соответственно известны как "золотая вилка" и "вилка смерти".
Long-short dividing line - Служащая одной из основ работы диапазона на основе колебательных индикаторов, long-short dividing line обычно относится к горизонтальной линии, проходящей через значение индекса, равное 0 или 50. Для индикатора KDJ разделительной линией long-short является горизонтальная линия, выровненная по значению 50 (горизонтальная линия, проходящая через значение 50), а разделительной линией long-short индикатора MACD является горизонтальная ось 0 (горизонтальная линия, выровненная по значению 0).
Применение линии K и линии D
Значения K и D находятся в диапазоне 0-100.
Когда значения K и D превышают 50, это указывает на то, что рынок находится в бычьем тренде и пора открывать длинные позиции. Если значения K и D опускаются ниже 50, это означает, что доминирует медвежий тренд, и трейдерам рекомендуется делать короткие позиции. В следующей таблице приведены возможные движения рынка, соответствующие различным значениям K и D :
Пересечение линий K и D
- Когда линия K и линия D находятся ниже уровня 50, а линия K идет вверх и пробивает линию D, это указывает на то, что рынок переживает раунд сильного подъема, и пришло время покупать больше активов или удерживать текущие позиции. Этот крест, образованный двумя линиями, представляет собой форму золотого креста индикатора KDJ. Как показано ниже.
- Когда линия K и линия D находятся ниже уровня 20, а линия K движется вверх, пробивая линию D, это указывает на то, что вялотекущий тренд скоро закончится и начнется бычий рынок. Цена прекратит падение и отскочит. Эти две линии пересекаются, образуя еще одну форму золотого креста индикатора KDJ. Как показано ниже:
- Когда линия K и линия D обе больше 80, а линия K опускается и пересекает линию D, это указывает на то, что рынок скоро превратится из бычьего тренда в медвежий, и цена валюты будет падать. Как только крест сформирован, также известный как крест смерти KDJ, пришло время избавиться от Ваших активов.
- Когда линия K и линия D обе больше 50, и линия K падает, пробивая линию D, это указывает на то, что рынок переживет очередной виток снижения, и цена валюты будет падать. В этом случае трейдерам предлагается продавать активы или просто подождать и посмотреть. Эта вилка - еще одна форма дэд-кросса KDJ.
Указания к сведению
- Пассивация индикатора
Пассивация индикатора происходит, когда линия индикатора колеблется вокруг граничного значения, в то время как цена продолжает двигаться в том же направлении, последовательно достигая новых максимумов или новых минимумов. В таких ситуациях индикатор дает мало рекомендаций, то есть он становится неэффективным в отражении рыночных настроений в экстремальных рыночных условиях. Осцилляторные индикаторы более подвержены пассивированию, поскольку они охватывают относительно меньший период, чем продолжительность экстремальных рыночных условий. Пассивацию индикатора можно разделить на пассивацию высокого уровня и пассивацию низкого уровня.
- Краткая информация
Осциллятор KDJ является широко используемым торговым индикатором, однако следует избегать бездумного использования индикатора, не разобравшись в торговом сценарии. Не существует универсального метода, который бы работал для всех случаев торговли. Трейдерам следует сочетать использование осциллятора KDJ с другими видами технического анализа, проверяя результаты с разных точек зрения.
Зарегистрируйте на контрактной платформе Gate.io, чтобы начать торговлю!

Отказ от ответственности
Обратите внимание, что данная статья предназначена только для информационных целей и не предлагает инвестиционных рекомендаций. Gate.io не может нести ответственность за любые принятые инвестиционные решения. На информацию, касающуюся технического анализа, суждений о рынке, торговых навыков и обмена информацией между трейдерами, не следует полагаться в инвестиционных целях. Инвестирование сопряжено с потенциальными рисками и неопределенностью, и данная статья не гарантирует доходность любых инвестиций.
Урок 1:Понимание скользящей средней
Урок 2:Подробное объяснение правил Granville 8
Урок 3:Применение одиночной скользящей средней
Урок 4:Применение двойной скользящей средней
Урок 5:Применение массива скользящих средних - Лонг паттерн
Урок 6:Применение массива скользящих средних - Шорт шаблон
Урок 7:Как использовать паттерны скользящих средних - Moving Average Cross
Урок 8:Как использовать паттерны скользящих средних - сцепление скользящих средних, конвергенция и дивергенция
Урок 9:Что такое трендовая торговля?
Урок 10:Что такое левосторонняя и правосторонняя торговля
Урок 11:Что такое линия тренда
Урок 12:Как использовать линию тренда
Урок 13:Линия поддержки и линия сопротивления
Урок 14:Применение MACD - короля индикаторов
Урок 15:Применение осциллирующего индикатора-KDJ
Урок 16:Применение индикатора относительной силы - RSI
Связанные курсы

Технический анализ: Полезный инструмент для понимания тенденций в торговле контрактами
Технический анализ: Полезный инструмент для понимания тенденций в торговле контрактами

Руководство по инвестированию в Gate.io Simple Earn
Руководство по инвестированию в Gate.io Simple Earn

Новое руководство по инвестированию в криптовалюту
Новое руководство по инвестированию в криптовалюту

Руководство по торговле контрактами Gate.io - обязательное чтение для новичков
Руководство по торговле контрактами Gate.io - обязательное чтение для новичков

Инвестирование в криптовалюты
Инвестирование в криптовалюты
