DirectorOfPIResearch
the most authoritative researchers on pi
- Reward
- 1
- 1
- Share
GateUser-2deff10a :
:
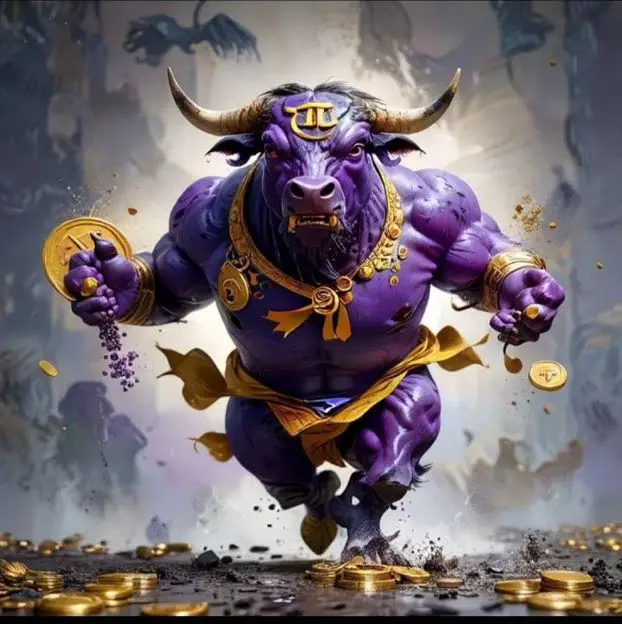
Each picture is a classic.- Reward
- like
- 6
- Share
What'sUp? :
:
Someone BUI him once, I will give him 100 PiView More
- Reward
- like
- Comment
- Share
- Reward
- like
- Comment
- Share
- Reward
- like
- Comment
- Share
- Reward
- like
- 2
- Share
GateUser-f67ebad8 :
:
Why are there only 18 exchanges displayed?View More
#PI# I looked at the daily chart k and it's quite regular. In May, there was one bullish candle followed by a downward movement for a month. In June, there was one bullish candle followed by a downward movement for a month. In July, there was another bullish candle yesterday, and you know the rest.
PI-2.35%

- Reward
- like
- Comment
- Share
- Reward
- like
- 1
- Share
LookingForwardToInfin :
:
A good hand can be played poorly, those two scoundrels.- Reward
- like
- 1
- Share
LookingForwardToInfin :
:
It's just that going down the mountain is always faster because it's rolling down. 😂- Reward
- like
- 1
- Share
LookingForwardToInfin :
:
It's 360 days a year of being scolded.- Reward
- like
- Comment
- Share
- Reward
- 1
- 1
- Share
GateUser-2f2ea9e6 :
:
You black dog, I'll first subdue you.- Reward
- 1
- 2
- Share
GateUser-a8233a99 :
:
Waiting.View More
- Reward
- like
- Comment
- Share
- Reward
- like
- Comment
- Share


