Duneの使用方法:101ガイド+ブックマークするトップダッシュボード
ブロックチェーンデータは高い技術的障壁の背後に閉じ込められるべきではありません。マーケターがキャンペーンのパフォーマンスを追跡したり、競合他社を監視したり、ユーザーパターンを分析したりする創業者や研究者であろうとも、@Dune Analytics は暗号通貨の洞察を得る方法を変革します。開発者でなくても、チェーン上で何が起こっているかを追跡する方法に興味がありますか?
ブロックチェーンデータは高い技術的障壁の背後にロックされているべきではありません。マーケターがキャンペーンのパフォーマンスを追跡し、競合他社をモニタリングする創業者であるか、ユーザーパターンを分析する研究者であるかにかかわらず、 @Dune分析は、暗号通貨の洞察をアクセスする方法を変えます。
新しいクエリを書きたくない場合でも、数千の事前に作成されたダッシュボードを閲覧して、豊富なオンチェーンデータを取得できます。SQを使用して誰でもクエリを実行し、ブロックチェーンデータを視覚化して共有できます。バックエンドのセットアップは不要です。
このガイドの対象者は誰ですか?
このガイドは、よりスマートに作業するためにブロックチェーンデータが必要なすべての人のために作成されています。
マーケターはキャンペーン、ユーザーフロー、およびエコシステムの成長を追跡しています
プロトコルメカニクスとユーザーの行動を分析する研究者
創業者&PMがアイデアの検証と競合他社のベンチマーキングを行っています
エンゲージメントを高め、コンバージョンを促進するダッシュボードを構築する成長チーム
あなたが学ぶこと
このガイドの最後までに、あなたは次のようになります:
Duneのインターフェースと検索機能をナビゲートします
DeFi、NFT、ロールアップ、およびステーブルコイン全体のトップダッシュボードを発見します
検索フィルターを使用して、高シグナルのクエリやクリエイターを見つけます
オンチェーンアクティビティをフィルタリング、集計、分析するための基本的なSQLを書いてください
Part 2 で独自のダッシュボードを構築を開始します
ステップ1:DiscoverタブでDuneを探索します
Duneに初めての方は、Discoverタブから始めてください。これはエコシステムを探索するためのホームベースです。
三つのメインセクション
DiscoverタブはDuneエコシステムへのゲートウェイです。
それは次のように分割されています:
コンテンツ:ダッシュボードとクエリを閲覧
Creators: トップ貢献者のようにフォローする@hildobby @CryptoKoryo, そしてその他
ブロックチェーン:複数のチャンネルでデータをフィルタリングする Ethereum、Base、Solana、Arbitrum など。
ソートオプション:
トレンド:今、人気のあるもの
最も人気のある:史上最高のヒット曲
ステップ2:Duneの検索構文をマスターする
Discoverページのトップ検索バーを使用してください。いくつかの強力な検索のヒント:

ステップ3:これらのハイシグナルダッシュボードから学ぶ
これは始めるためのいくつかの高シグナルダッシュボードです。
1.DEX メトリクス by @hagaetc:https://dune.com/hagaetc/dex-metrics
DEX、チェーン、アグリゲーター間の取引量
時間の経過とともに市場シェア
取引規模の内訳:大口取引者 vs 小売取引者
Solana DEXs、Telegramボット、注文フローのトレンド

2.@hildobbyによるEthereum NFT概要:https://dune.com/hildobby/ethereum-nfts
取引高、ユーザー数、アクティブトレーダー
ウォッシュ取引対有機的な取引量
マーケットシェア:Blur、OpenSea、Magic Eden

3.Crypto Buy Signal by @CryptoKoryo:https://dune.com/cryptokoryo/crypto-buy-signal
BTC対アルトコインのトレンドシグナル
市場サイクル:買いエリアか配布エリアか?
マクロレベルの暗号信号

4.ETH ステーキング概要@hildobby:https://dune.com/hildobby/eth2-staking
総ステークされたETHと供給量の%
Lido、Coinbase、Binance、ether.fi市場シェア
上海後のステーキング流入/流出
- CEX対LSD対ステーキングプール

5.ERC20 トークンメトリクス @andrewhong5297:https://dune.com/ilemi/Token-Overview-Metrics
トークン配布
ホルダー集中度
DEXの流動性と利用
新規ユーザー対ダンパー対アキュムレーター

6.DeFiユーザー成長 @richardchen39:https://dune.com/rchen8/defi-users-over-time
DeFi採用のトレンド
時間とともにユーザーベース

7.Rollup Economics by @0xKofi:https://dune.com/niftytable/rollup-economics
L1コストデータ:コールデータ、ブロブ、証明検証
トランザクション手数料からのロールアップ収益
L1コストを考慮した後、ロールアップは利益が出るのでしょうか?

8.ステーブルコイン概要について @RZinovyev:https://dune.com/KARTOD/stablecoins-overview
フィアット対クリプト対アルゴ裏付け供給
ミント/バーン活動
市場シェアの推移
ステーブルコインごとのオンチェーン取引量
USDC/USDTによって禁止されたアドレス

プロジェクト固有のダッシュボード
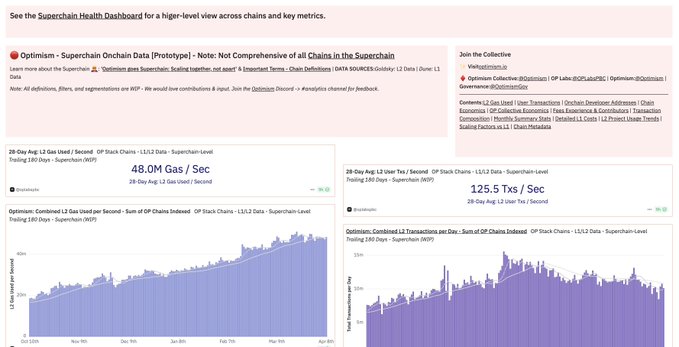
9.オプティミズムスーパーチェーンバイ@OPLabsPBC:https://dune.com/oplabspbc/op-stack-chains-l1-activity
OP Mainnet、Base、Zora、Modeを横断するL2アクティビティ
L1データのコスト効率
OP Collective 収益貢献度
DAコストを差し引いたオンチェーン利益
OPチェーン全体の開発者トレンド
10.GMX Analytics by @GMX_IO:https://dune.com/gmx-io/gmx-analytics
TVL、取引高、手数料データ(Arbitrum + Avalanche)
ロング/ショートオープンインタレスト
ウィークリー/デイリートレーダーPnL
プールによる市場利用
デイリー/ウィークリーユーザーアクティビティ

ボーナスのヒント:もっとクリエイターを探索する
このリストはいくつかの主要なダッシュボードを強調していますが、素晴らしい仕事をしている他のクリエイターもたくさんいます。
チェックアウト:
@EntropyAdvisors–https://dune.com/entropy_advisors
@dyorcryptoapp –https://dune.com/dyorcrypto
これ以上数十もの価値があるものがあります。Dune内のCreatorsタブで時間を過ごす — 学び、インスピレーションを得る最良の方法の1つです。
ステップ4:Duneでの最初のSQLクエリ
ダッシュボードを調査したり、フィルタを操作したりしてきましたね。でも、今度は自分自身でインサイトを構築したいですよね?
このセクションでは、最初のSQLクエリの書き方、DuneのEthereumデータテーブルの理解、そしてわずか数つの強力なコマンドを使用して基本的なメトリクスを自信を持って分析する方法を学びます。
始めましょう。
イーサリアムデータがデューンテーブルにマッピングされる方法
Duneを巨大なExcelワークブックのようなものと考えてみてください:
各テーブル=スプレッドシート(例:ethereum.transactions)
各行=取引またはイベント
各列=データの一部(例:From、To、Value、Block_time)
Duneはこの生のブロックチェーンデータをいくつかのタイプのテーブルに整理しています:

すべては取引から始まります。イベント(ログ)や内部呼び出し(トレース)がその中で発生します。
あなたの最初のSQLクエリ
Duneで最初のクエリを実行するには、トップナビゲーションバーのLibraryをクリックし、次にNew Queryをクリックします。
以下を貼り付け:
SELECT * FROM ethereum.transactions LIMIT 10;
実行をクリックすると、クエリの下にテーブル形式で出力が表示されます。
これは、Ethereumで最初に記録された10件の取引が表示されるだけです(Duneに保存されています)。

さて、筋肉を鍛えましょう。 💪
WHEREでフィルタリング
特定のウォレットからトランザクションを見つけましょう:
SELECT
*
FROM ethereum.transactions
どこ
「from」= 0xabcd…
LIMIT 10
ブロック時間でフィルターもできます。
SELECT
*
FROM ethereum.transactions
WHERE
block_time >= CURRENT_TIMESTAMP - INTERVAL ‘1’ day
LIMIT 20
特定の列の選択
必要な列がわずかな場合:
SELECT hash, “from”, “to”, value FROM ethereum.transactions LIMIT 5;
🔹 ハッシュ: トランザクションの固有ID
🔹価値:ETHが送信された金額(wei単位、変換が必要)
ソートおよび注文結果
SELECT hash, block_time FROM ethereum.transactions ORDER BY block_time DESC LIMIT 5;
DESCは最新順を意味します。最も古い順にはASCを使用してください。
GROUP BYで集計
各アドレスが送信した取引の数を数えてみましょう:
SELECT “from”, COUNT(*) AS total_sent FROM ethereum.transactions GROUP BY “from” ORDER BY total_sent DESC LIMIT 10;
あなたはちょうど最初の集計を行いました 👏
COUNT()は基本的なメトリクスにとって最良の味方です。
役立つSQL数学関数
数学も適用できます:
SELECT “from”, SUM(value)/1e18 AS total_eth_sent FROM ethereum.transactions GROUP BY “from” ORDER BY total_eth_sent DESC LIMIT 5;

1e18ウェイをETHに変換します
SUM(value)はアドレスごとに送信されたETHの合計を示します
エイリアシング:列を読みやすくする
SELECT hash AS tx_id、block_time AS time、value / 1e18 AS eth_value FROM ethereum.transactions LIMIT 5;
ユニークな値を取得する
最近イーサリアムとやり取りしたユニークアドレスの数を知りたいですか?
SELECT COUNT(DISTINCT "from") AS unique_senders
ethereum.transactionsから
block_time >= now() - INTERVAL ‘3’ DAYを超過
タイムスタンプを使用する
特定の日付でフィルタリングする方法は次のとおりです:
SELECT * FROM ethereum.transactions WHERE block_time > TIMESTAMP ‘2025-04-04 00:00:00’;
date_trunc() を使用して時間を間隔に切り捨てることもできます。
SELECT
date_trunc('day'、block_time)AS day、
COUNT(*) AS txs
FROM ethereum.transactions
GROUP BY 1
1 DESCで並べ替え
LIMIT 10

ボーナス:すべてのこれらのスキルを組み合わせる
最近の取引として (
SELECT
*
FROM ethereum.transactions
WHERE
block_time >= CURRENT_TIMESTAMP - INTERVAL ‘3’ day
)
SELECT
「from」
COUNT(*) AS tx_count,
SUM(value) / 1e18 AS total_eth_sent
最近の取引から
GROUP BY
「from」
並べ替える
total_eth_sent DESC
制限10

終わりに、次は何ですか?
ここまで来たら、自分にスパークリングウォーターをご褒美にしてください。あなたはそれに値します。
Duneでオンチェーンデータ分析の世界への第一歩を踏み出したばかりです。
しかし、これはただ始まりです。
クエリに慣れてきたら、Duneの本当の力が発揮されます: テーブルの接続、スマートコントラクトログのデコード、成長、戦略、ストーリーテリングを支えることができるダイナミックなダッシュボードの構築。
免責事項:
- この記事は[から転載されていますStacy Muur]. All copyrights belong to the original author [ステイシー・ムーア]. If there are objections to this reprint, please contact the Gate Learnチームが promptly に対処します。
- 責任の免責事項:この記事で表現されている意見や見解は、著者個人のものであり、投資アドバイスを構成するものではありません。
- Gate Learnチームは、記事の翻訳を他の言語に行います。許可がない限り、翻訳された記事のコピー、配布、または盗用は禁止されています。
関連記事


ブロックチェーンについて知っておくべきことすべて

ステーブルコインとは何ですか?
