حالة التمويل الرقمي
مقدمة
الإقراض والاقتراض هما حالتان استخدام للعملات الرقمية وجدا حلاً قوياً للسوق سواء داخل السلسلة أو خارجها، حيث وصلت قيمة هذه الفئة بأكملها إلى أكثر من 64 مليار دولار في ذروتها. لقد لعب سوق الإقراض دورًا مهمًا أيضًا في بناء نظام مالي على أساس الأصول الرقمية، مما يتيح للمستخدمين الحصول على سيولة على أصولهم لتنفيذ عمليات في مجال التمويل اللامركزي والتداول في الأماكن داخل السلسلة وخارجها.
يستكشف هذا التقرير أسواق الإقراض للعملات الرقمية على السلسلة وخارجها. وهو مقسم إلى قسمين: يقدم القسم الأول تاريخ سوق الإقراض الرقمي، والجهات المشاركة فيه، وحجمه التاريخي (على السلسلة وخارجها)، وبعض اللحظات المحورية في القطاع. الجزء الثاني من التقرير يغوص في كيفية عمل بعض منتجات الإقراض ومصادر الرافعة المالية الأخرى في إعدادات السلسلة وخارجها، ومن يستخدمها، ومخاطر كل منها. يقدم التقرير رؤية شاملة لسوق الإقراض للعملات الرقمية، مسلطا الضوء على أحد أكثر القطاعات استخداما وشفافية في اقتصاد العملات الرقمية. وبشكل حاسم، يوفر التقرير رؤية نادرة لحجم سوق الإقراض خارج السلسلة، وهو جزء تاريخيا غامض من الصناعة.
نقاط رئيسية
- حجم سوق الإقراض الرقمي بشكل عام لا يزال يقل بشكل ملموس عن الذروات التي تم تحقيقها في نهاية 2020-2021 في سوق العملات الرقمية. الحجم الإجمالي لسوق الإقراض الرقمي حتى الربع الرابع من عام 2024 بما في ذلك الاستقرار للعملات المشفرة المدعومة بالضمانات (CDP) هو 36.5 مليار دولار، بانخفاض قدره 43% عن أعلى مستوى تاريخي بلغ 64.4 مليار دولار في الربع الرابع من عام 2021. يمكن أن يعزى الانخفاض إلى تدمير القرضاء على الجانب العرضي، والأموال، والأفراد، والكيانات الشركاتية على الجانب الطلبي.
- أعلى 3 مقرضين CeFi حتى الربع الرابع من عام 2024 تشمل Tether و Galaxy و Ledn مجتمعين لحجم كتاب قروض بقيمة 9.9 مليار دولار في نهاية الربع الرابع من عام 2024. معًا، يشكلون 88.6٪ من سوق الإقراض CeFi و 27٪ من إجمالي سوق الإقراض للعملات الرقمية بما في ذلك stablecoins مدعومة بالعملات الرقمية.
- تطبيقات الإقراض Onchain قد شهدت نموًا قويًا منذ قاع سوق الدببة البالغ 1.8 مليار دولار في الاقتراض المفتوح في نهاية الربع الرابع من عام 2022. كان هناك 19.1 مليار دولار من الاقتراض المفتوح عبر 20 تطبيق إقراض و 12 سلسلة كتلية بحلول الربع الرابع من عام 2024. وهذا يمثل زيادة بنسبة 959% في الاقتراض في DeFi عبر ثمانية أرباع.
السوق
هناك قناتان رئيسيتان من خلالهما تُقدم خدمات الإقراض والاقتراض القائمة على العملات الرقمية، بما في ذلك اللامركزية والمركزية، حيث تحمل كل منهما خصائصها الخاصة والمنتجات المقدمة. فيما يلي نظرة عامة موجزة حول قروض اللامركزية والمركزية.
- التمويل المركزي (CeFi) - شركات تمويل مركزية خارج السلسلة الرئيسية التي تقدم خدمات الإقراض والاقتراض للعملات المشفرة والأصول ذات الصلة بالعملات المشفرة. تستخدم بعض هذه الكيانات البنية التحتية على السلسلة أو لديها جميع أعمالها مبنية على السلسلة. هناك ثلاثة أنواع رئيسية من التمويل المركزي:
- خارج البورصة (OTC) - تقدم صفقات OTC من قبل المؤسسات المركزية وتوفر مجموعة شاملة من حلول الإقراض المخصصة والمنتجات. تُجرى صفقات OTC على أساس ثنائي، مما يتيح الترتيبات المخصصة بين المقترضين والمقرضين. تُخصص شروط ترتيبات OTC لتلبية احتياجات الطرفين المحددة، بما في ذلك أسعار الفائدة والانتهاء ونسبة القرض إلى القيمة (LTV). عادةً ما تكون هذه العروض متاحة فقط للمستثمرين المعتمدين والمؤسسات.
- Prime Brokerage – منصة تداول متكاملة تقدم خدمات التمويل بالهامش وتنفيذ الصفقات والحفظ. يمكن للمستخدمين إما سحب تمويل الهامش من الوسطاء الرئيسيين لاستخدامه في مكان آخر أو الاحتفاظ به على المنصة لأنشطة التداول. عادة ما يقدم الوسطاء الرئيسيون التمويل على مجموعة محدودة من أصول التشفير وصناديق الاستثمار المتداولة المشفرة.
- Onchain Private Credit – يسمح للمستخدمين بتجميع الأموال على السلسلة الرئيسية ونشرها من خلال اتفاقيات وحسابات خارج السلسلة. في هذه الحالة، يصبح سلسلة الكتل الأساسية منصة لجمع التمويل والمحاسبة لطلبات خارج السلسلة للحصول على الائتمان بشكل فعال. يتم ترميز الدين غالبًا، سواء كموقف ديني مستقر (CDP) أو مستقرات مشفرة مباشرة من خلال الرموز التي تمثل حصصًا في حوض الديون. استخدام عائدات الديون عادةً ما يكون محدوداً.
- التمويل اللامركزي (DeFi) - التطبيقات التي تعمل بالعقود الذكية وتعيش على سلاسل الكتل، مما يتيح للمستخدمين استعارة على عملاتهم الرقمية، أو إعارتها لتحقيق عوائد، أو استخدامها للحصول على رافعة مالية عند التداول. يتمتع التمويل والاقتراض اللامركزي بصفات مميزة تتمثل في العمل 24 ساعة في اليوم و7 أيام في الأسبوع، وتوفير مجموعة واسعة من الأصول التي يمكن استعارتها واستخدامها كضمان، وكونها شفافة تمامًا وقابلة للتدقيق من قبل أي شخص. تطبيقات الاقتراض، والعملات المستقرة المرتبطة بالضمانات الخاصة، والبورصات غير المركزية تتيح للمستخدمين الحصول على رافعة مالية على السلسلة.
- تطبيقات الإقراض - تطبيقات على السلسلة الكتلية تتيح للمستخدمين إيداع الأصول الضامنة، مثل بيتكوين وإيثيريوم، والتي يمكنهم استعارة عملات رقمية أخرى ضدها. تم تحديد شروط القروض، والتي تستند إلى الأصول الضامنة المقدمة والأصول المستعارة، من خلال تقييم مخاطر يجريه التطبيق. الإقراض والاقتراض من خلال هذه التطبيقات مشابه للإقراض الذي يعتمد على الضامن الزائد تقليدياً.
- مواقف الديون الرهنية للعملات المستقرة - عملات دولار أمريكي مستقرة تم تغطية قيمتها بواسطة عملات رقمية فردية، أو سلة منها. إنه مشابه في المبدأ للإقراض والاقتراض المتغطيان بفائض التغطية، ومع ذلك، يتم إصدار أصل اصطناعي ضد الرهن الذي قام به المستخدمون.
- تبادلات لا مركزية - تسمح بعض تبادلات العملات الرقمية غير المركزية للمستخدمين بالحصول على رافعة مالية لتكبير مواقعهم التجارية. بينما تختلف وظيفة تبادلات العملات الرقمية غير المركزية، إلا أن دور الذين يقدمون الهامش مشابه لدور وسطاء الهامش في سيفي. عادةً ما لا تكون العائدات قابلة للتحويل من التبادل غير المركزي، ومع ذلك.
تسلط خريطة السوق أدناه الضوء على بعض اللاعبين الرئيسيين السابقين والحاليين في سوق إقراض العملات المشفرة CeFi و DeFi. انهار بعض أكبر مقرضي CeFi حسب حجم دفتر القروض في عامي 2022 و 2023 حيث انهارت أسعار الأصول المشفرة وجفت السيولة في السوق. أبرزها Genesis و Celsius Network و BlockFi و Voyager جميعها تقدمت بطلب للإفلاس خلال فترة العامين. أدى ذلك إلى انهيار يقدر بنحو 78٪ في حجم أسواق الإقراض CeFi و DeFi مجتمعة من ذروة عام 2022 إلى قاع السوق الهابطة ، حيث خسر إقراض CeFi 82٪ من قروضه المفتوحة. سيتم تغطية المزيد عن تاريخ وتطور وحجم سوق إقراض العملات المشفرة في الأقسام التالية.

يرسم الجدول أدناه مقارنات بين بعض أكبر مقرضي العملات المشفرة CeFi تاريخيا. تقدم بعض الشركات المدرجة خدمات متعددة للمستثمرين ، مثل Coinbase التي تعمل بشكل أساسي كبورصة ولكنها تقدم الائتمان للمستثمرين من خلال قروض العملة المشفرة خارج البورصة وتمويل الهامش.

تاريخ إقراض العملات الرقمية
على الرغم من أن إقراض العملات المشفرة onchain و offchain لم يصبح مستخدما على نطاق واسع حتى أواخر عام 2019 / أوائل عام 2020 ، إلا أن بعض اللاعبين الحاليين والمهمين تاريخيا تشكلوا في وقت مبكر من عام 2012. والجدير بالذكر أن جينيسيس ، التي حملت دفتر قروض يصل إلى 14.6 مليار دولار ، تأسست في عام 2013. تم إطلاق الإقراض Onchain وعمالقة العملات المستقرة CDP ، مثل Aave و Sky (MakerDAO سابقا) و Compound Finance ، على Ethereum بين عامي 2017 و 2018. لم تكن حلول الإقراض / الاقتراض هذه ممكنة إلا من خلال ظهور Ethereum والعقود الذكية ، والتي تم إطلاقها في يوليو 2015.
انتهاء ذيل سوق الثيران 2020-2021 كان بداية فترة مضطربة تعاني من الافلاسات لسوق الإقراض الرقمي. الأحداث الملحوظة في هذا الوقت تضمنت فك تثبيت عملة تيرا الثابتة، UST، التي ستصبح في نهاية المطاف بلا قيمة إلى جانب LUNA؛ فك تثبيت أكبر رمز للرهن السائل على شبكة الإثريوم (LST)، stETH؛ وتداول أسهم الثقة بيتكوين Grayscale، GBTC، بخصم عن القيمة الأصولية الصافية (NAV) بعد سنوات من التداول بعلاوة متزايدة.

تحجيم السوق
حجم سوق الإقراض الرقمي المشترك لـ DeFi و CeFi لا يزال بعيدًا بشكل ملحوظ عن أعلى مستويات تم تحقيقها في الربع الأول من عام 2022 حسب القياسات باستخدام لقطات نهاية الربع. يعود ذلك إلى حد كبير إلى عدم تعافي الإقراض CeFi بعد سوق الدببة في عام 2022 وتدمير أكبر المقرضين والمقترضين في السوق. يتناول ما يلي حجم سوق الإقراض الرقمي من خلال عدسات CeFi والأماكن اللامركزية.
في ذروته، تقدر بحوالي Galaxy Research أن حجم القروض المجمعة لمقرضي CeFi الذين تتوفر لديهم بيانات كان 34.8 مليار دولار؛ في وقت تقديري للحد الأدنى، يقدر المكتب سوق الإقراض CeFi بقيمة 6.4 مليار دولار (انخفاض بنسبة 82٪). في نهاية الربع الرابع من عام 2024، حجم القروض القائمة لـ CeFi هو 11.2 مليار دولار، أي بنسبة 68٪ تحت أعلى مستوى على الإطلاق وزيادة بنسبة 73٪ عن الحد الأدنى في سوق الدببة.

مع تقلص سوق الإقراض في مجال العملات الرقمية المركزية خلال السنوات الثلاث الماضية، تم تجميع كمية القروض الباقية عبر عدد أقل من المقرضين. في ذروة سوق الإقراض في مجال العملات الرقمية المركزية في الربع الأول من عام 2022، كانت الثلاثة مقرضين الأوائل (جينيسيس، بلوكفاي، وسيلسيوس) يشكلون 76% من السوق، بحيازتهم 26.4 مليار دولار من إجمالي القروض البالغ 34.8 مليار دولار التي تمتلكها فئة مقرضي العملات الرقمية المركزية. اليوم، يحتفظ الثلاثة مقرضين الأوائل (تيثر، غالاكسي، وليدن) بحصة سوقية مجتمعة تبلغ 89%.
عند تقييم السيطرة على السوق لأحد الجهات الإقراضية على الأخرى، من المهم ملاحظة الاختلافات بين كل جهة إقراض، حيث لا تختلف جميع جهات الإقراض المركزية الرقمية. بعض الجهات الإقراض تقدم فقط أنواعًا معينة من القروض (مثل القروض المرصودة فقط بالبيتكوين، منتجات الرموز البديلة المرصودة بالعملات الرقمية، وقروض النقد التي لا تتضمن العملات المستقرة)، وتخدم فقط أنواعًا معينة من العملاء (مثل الهيئات مقابل التجزئة)، وتعمل فقط في اقليم معين. يسمح تجمع هذه النقاط لبعض جهات الإقراض بالتوسع بشكل أكبر من غيرها تلقائيًا.

كما يظهر من الرسم البياني أدناه، فإن إقراض ديفي من خلال تطبيقات السلسلة الكتلية، مثل Aave و Compound، قد شهد نموا قويا من قاعدة السوق الدببة بقيمة 1.8 مليار دولار في الاقتراض المفتوح. وكان هناك 19.1 مليار دولار في الاقتراض المفتوح عبر 20 تطبيقًا للإقراض و 12 سلسلة كتلية في نهاية الربع الرابع من عام 2024. وهذا يمثل زيادة بنسبة 959٪ في الاقتراض المفتوح من ديفي على السلاسل والتطبيقات المرصودة في الثمانية أرباع منذ تحديد القاع. وفي لقطة الربع الرابع من عام 2024، كانت كمية القروض الباقية من خلال تطبيقات الإقراض عبر السلسلة الكتلية 18٪ أعلى من الذروة السابقة بقيمة 16.2 مليار دولار التي تم تحديدها خلال سوق الثيران 2020-2021.
شهدت الاقتراض في ديفي انتعاشًا أقوى من الإقراض في سيفي. يمكن أن يعزى ذلك إلى الطبيعة غير المرخصة لتطبيقات البلوكشين واستمرار تطبيقات الإقراض خلال فوضى السوق الدبية التي أسقطت المقرضين الرئيسيين في سيفي. على عكس أكبر مقرضي سيفي الذين أفلسوا وتوقفوا عن العمل، لم يكن على جميع تطبيقات الإقراض والأسواق الكبرى إغلاقها واستمرت في العمل. هذه الحقيقة تشهد على تصميم تطبيقات الإقراض الكبيرة على البلوكشين وممارسات إدارة المخاطر، وفوائد الاقتراض الخوارزمي والمضمون بشكل زائد، والقائم على العرض / الطلب.
سوق الإقراض الرقمي، باستثناء حد سوق العملات المستقرة المرصوفة بالعملات الرقمية، وصل إلى ذروته عند 48.4 مليار دولار في الاقتراض المفتوح بشكل مجتمعي في نهاية الربع الرابع من عام 2021. وقد بلغ السوق التراكمي أدنى مستوى له بعد أربعة أرباع في الربع الرابع من عام 2022 عند 9.6 مليار دولار، بانخفاض بنسبة 80٪ عن الذروة. ومنذ ذلك الحين، توسعت السوق الإجمالية إلى 30.2 مليار دولار، بدفع كبير من توسيع تطبيقات الإقراض DeFi، ممثلة نموًا بنسبة 214٪ باستخدام لقطات نهاية الربع الرابع من عام 2024.
يرجى ملاحظة أن هناك احتمالًا للاحتساب المزدوج بين حجم القرض الكلي لمؤسسات تمويل العملات المشفرة والاقتراضات في مجال العملات الرقمية. يعود ذلك إلى حقيقة أن بعض كيانات تمويل العملات المشفرة تعتمد على تطبيقات الإقراض في مجال العملات الرقمية لخدمة الاقتراضات لعملاء خوارج السلسلة. على سبيل المثال، قد يستخدم مقرض مفترض في مجال تمويل العملات المشفرة عملات BTC الخاملة للاقتراض من USDC في السلسلة، ثم يوسع هذا الـ USDC نفسه لمقترض خارج السلسلة. في هذه الحالة، سيتم عرض القرض على السلسلة الخاص بمقرض تمويل العملات المشفرة في الاقتراضات المفتوحة في مجال العملات الرقمية وفي البيانات المالية للمقرض كاقتراض مفتوح لعميله. يجعل عدم الكشف والتنسيب على السلسلة من الصعب تصفية هذه الديناميكية.

تطور ملحوظ في سوق الإقراض المشفر هو السيطرة في تطبيقات DeFi للإقراض على الأماكن في CeFi مع تقدم السوق خلال السوق الهابط وبداية التعافي. حصة تطبيقات DeFi للإقراض من إجمالي الاقتراض بالعملات المشفرة، باستثناء سقف سوق العملات المستقرة المضمونة بالعملات المشفرة، بلغت 34% فقط خلال دورة الثورة لعامي 2020 - 2021؛ حيث وصلت إلى 63% حتى الآن في الربع الرابع من عام 2024، تقريبًا مضاعفة السيطرة الخاصة بها.

بما في ذلك سقف سوق العملات الرقمية المستقرة المرصودة بالعملات المشفرة، بلغ حجم السوق الإجمالي للإقراض بالعملات الرقمية 64.4 مليار دولار في الربع الرابع من عام 2021. في قاع السوق الدبية في الربع الثالث من عام 2023، بلغت قيمتها فقط 14.2 مليار دولار، ممثلة انخفاضًا بنسبة 78٪ عن أعلى السوق الثورية. حتى الربع الرابع من عام 2024، استعادت السوق 157٪ من القاع في الربع الثالث من عام 2023 لتصل إلى حجم إجمالي قدره 36.5 مليار دولار.
مذكرة، مثل الاقتراض من خلال تطبيقات الإقراض DeFi، هناك إمكانية للعد الضعفي بين حجم دفتر القروض الإجمالي لـ CeFi وإمداد العملة المستقرة لـ CDP. يرجع ذلك إلى حقيقة أن بعض الكيانات CeFi تعتمد على طباعة عملات CDP المستقرة بضمان عملات مشفرة لخدمة الاقتراض لعملاء خارج السلسلة.

اتجاه مبالغ فيه أكثر في حصة السوق المتزايدة للإقراض والاقتراض على السلسلة الإلكترونية يُلاحَظ عندما تُشمَل العملات المستقرة المدعومة بالعملات المشفرة. في ختام الربع الرابع من عام 2024، استولت تطبيقات الإقراض ديفي والعملات المستقرة المدعومة بالعملات المشفرة على 69٪ مجتمعة من السوق بأكمله. لقد كانت حصته في ارتفاع مستمر منذ الربع الرابع من عام 2022. لاحظ مراقبو السوق تراجع سيطرة العملات المستقرة المدعومة بالعملات المشفرة كمصدر للرافعة المالية المدعومة بالعملات المشفرة. يمكن أن يُنسَب ذلك جزئيًا إلى زيادة سيولة العملات المستقرة وتحسين المعلمات على تطبيقات الإقراض وإدخال عملات مستقرة محايدة مثل إثينا.

منطق ومصادر بيانات السوق
تسلط الجدول أدناه الضوء على كل من المصادر والمنطق المستخدمين في تجميع بيانات سوق الاقتراض DeFi وCeFi المستخدمة أعلاه. بينما يمكن الوصول إلى بيانات DeFi وcDeFi من خلال بيانات السلسلة، التي تكون شفافة وسهلة الوصول، إلا أن استرداد بيانات CeFi أكثر صعوبة وأقل توافرًا. يعود ذلك إلى تناقضات في كيفية معاملة مقرضي CeFi لقروضهم الغير مسددة، وترددات التي يجعلون بها المعلومات عامة، وصعوبات حول الوصول العام لهذه المعلومات.

الاستثمار الاستثماري والإقراض الرقمي
تمكنت تطبيقات ومنصات الإقراض والائتمان CeFi وDeFi من جمع ما يصل إلى 1.63 مليار دولار من خلال صفقات تم التعرف على مبالغ جمعها بين الربع الأول من عام 2022 والربع الرابع من عام 2024 عبر 89 صفقة. تم جمع أكبر كمية من رأس المال في هذا القطاع على أساس ربع سنوي في الربع الثاني من عام 2022، حيث تم جمع ما يصل إلى 502 مليون دولار على الأقل في تمويل عبر ثماني صفقات. كان الربع الرابع من عام 2023 أقل شهر من حيث إجمالي التمويل بمبلغ 2.2 مليون دولار.

التخصيص الاستثماري للقروض وتطبيقات الائتمان لم يشكل سوى جزء صغير من إجمالي رأس المال الاستثماري لرأس المال الاستثماري لرأس المال الاستثماري لرأس المال الاستثماري لرأس المال الاستثماري لرأس المال الاستثماري لرأس المال الاستثماري لرأس المال الاستثماري لرأس المال الاستثماري لرأس المال الاستثماري لرأس المال الاستثماري لرأس المال الاستثماري لرأس المال الاستثماري لرأس المال الاستثماري لرأس المال الاستثماري لرأس المال الاستثماري لرأس المال الاستثماري لرأس المال الاستثماري لرأس المال الاستثماري لرأس المال الاستثماري لرأس المال الاستثماري لرأس المال الاستثماري لرأس المال الاستثماري لرأس المال الاستثماري لرأس المال الاستثماري لرأس المال الاستثماري لرأس المال الاستثماري لرأس المال الاستثماري لرأس المال الاستثماري لرأس المال الاستثماري لرأس المال الاستثماري لرأس المال الاستثماري لرأس المال الاستثماري للرأس المال الاستثماري للرأس المال الاستثماري للرأس المال الاستثماري

إشارة إلى أبحاث غالاكسي تغطيةمن مجال رأس المال الاستثماري في مجال العملات الرقمية للحصول على رؤية أشمل للاتجاهات التاريخية في تمويل رأس المال الاستثماري للعملات الرقمية.
ما الذي حدث بشكل خاطئ؟
شهدت النصف الثاني من عام 2022 حتى أوائل عام 2023 انهيارًا عنيفًا في سوق الإقراض الرقمي حيث تعرض أكبر اللاعبين في القطاع للإفلاس. وشمل ذلك كل من BlockFi و Celsius و Genesis و Voyager، التي شكلت معًا 40٪ من سوق الإقراض الرقمي بأكمله و 82٪ من سوق الإقراض CeFi في ذروتها. كانت سقوط هؤلاء القروضاء في النهاية بسبب انهيار سوق العملات الرقمية بشكل عام، على الرغم من أن إدارتهم السيئة للمخاطر وقبولهم للضمانات السامة من المقترضين قد زاد من مشاكلهم.
تفجير السوق الرقمية وتأثيره على قيم الضمان
كان انهيار أسعار الأصول العامل الرئيسي الذي أجبر على فك الائتمان في سوق القروض الرقمية. باستثناء بتك، يو إس دي سي، و يو إس دي تي، فقدت سقف السوق للأصول الرقمية ما يقرب من 1.3 تريليون دولار (77%) من القيمة خلال الفترة 406 يومًا بعد تحقيق أعلى مستوى للدورة في 9 نوفمبر 2021. وشملت هذه الأرقام القضاء الكلي على حوالي 18.7 مليار دولار من UST لتيراعملة مستقرةوحوالي 39 مليار دولار منLUNA العملة. وقد أدى ذلك إلى وجود أصول ضمانية كانت إما لا قيمة لها أو صعبة التصرف فيها مع نضوب السيولة، وترك المقترضين عالقين في صفقات لم تعد مربحة.

الثقة بالبيتكوين من Grayscale والإيثيريوم المشارك المسوب
أدى الاتجاه الهابط في السوق إلى تحول الأصول الرهنية الشائعة بين المقترضين المؤسسيين إلى سامة. ومن الجدير بالذكر أن الأصول غير السائلة مثل stETH، GBTC، وآلات تعدين بيتكوين ASIC (دارة تكاملية مخصصة لتطبيق معين) أدت إلى تسارع تخفيض قيمة الرهنية الشائعة.
المشكلة مع stETH و GBTC على وجه الخصوص كانت في أنهم لم يمنحوا المستثمرين امتياز استرداد أصولهم: ETH في حالة stETH و BTC في حالة GBTC. في ذلك الوقت، سلسلة Ethereum Beacon Chainسحب الرهنلم يتم تمكينها، مما يمنع المستخدمين من المطالبة بالإيثريوم الذي قفلوه في عقود الرهن، ولم يسمح GBTC للمستثمرين بالمطالبة بالبيتكوين تحت كل حصة بسبب القيود في هيكل المنتج. هذا يعني أن سوق السيولة الثانوية لـ stETH و GBTC، والتي كانت أضعف بكثير من تلك الأصول الأساسية لها، كان عليها دعم كامل وزن الضغط على البيع. النتيجة النهائية كانت أن هذه الأصول تتداول بخصومات عن قيمة أصولها الأساسية، مما عجل بالضغط الشديد المفروض بالفعل على ضمانات الأصول الرقمية. انخفضت الخصومة لـ stETH إلى أدنى مستوى بنسبة 6.25% وخصومة GBTC بنسبة تصل إلى 48.9% بينما كانت السوق تتخلص من الأوزان.

ASICات بيتكوين
حدث ديناميكية مماثلة مع قروض بيتكوين المستندة إلى ASIC المُمهّلة للمُنقبين. المشكلة في ASICs كضمان كانت مزدوجة: 1) الإيرادات التي تولدها، وفي نهاية المطاف قيمتها، مرتبطة بسعر بيتكوين وصعوبة التعدين, و2) إطلاق الأجهزة من الجيل الجديد يضع ضغطًا على قيم الأجهزة من الأجيال السابقة. هذه العوامل، جنبًا إلى جنب مع طبيعة عدم السيولة لأجهزة التعدين، أدت إلى خسائر فاقت الحجم في قيم الأجهزة مقارنة بالبيتكوين، أو العجز المطلق في التخلص من الأجهزة المستخدمة كضمان.
سعر الهاش هو مقياس للإيرادات اليومية المقدرة لكل وحدة من قوة التعدين (قبل تكاليف التعدين) لجهاز ASIC. عادة ما يُعبر عنه بالدولار لكل تيراهاش (TH/s) أو الدولار لكل بيتاهاش (PH/s). على سبيل المثال، يُقدر أن يكسب جهاز بقوة تعدين .1 بيتاهاش بسعر هاش قدره 100 دولار لكل بيتاهاش 10 دولارات من الإيرادات يوميًا قبل تكاليف التشغيل. يمكن استخدام هذا الرقم، جنبًا إلى جنب مع عوامل أخرى، لاستخلاص وتخفيض الإيرادات/الأرباح المستقبلية للوصول إلى قيمة الجهاز.
يسلط الرسم البياني أدناه الضوء على الاتجاه في سعر التجزئة والصعوبة خلال السوق الهابطة لعام 2022. بلغ سعر التجزئة 403 دولارات لكل PH / s عند أعلى سعر إغلاق لدورة البيتكوين البالغ 67,600 دولار وبصعوبة عند ~ 21.7 تريليون تجزئة في نوفمبر 2021. في الأشهر ال 13 التي تلت ذلك ، انخفض سعر البيتكوين بنسبة 75٪ إلى ~ $ 16,600 وارتفعت الصعوبة بنسبة 58٪ ، مما دفع سعر التجزئة ، وبالتالي الإيرادات المقدرة ل ASICs ، انخفضت بنسبة 86٪. لاحظ الفرق بنسبة 11٪ بين أداء البيتكوين وانهيار سعر التجزئة. هذه الدلتا ترجع إلى زيادة صعوبة التعدين. تشير الصعوبة المتزايدة إلى مزيد من المنافسة بين عمال المناجم والتي ، عندما تقترن بالإصدار اليومي الثابت للبيتكوين ، تنتهي بأقل BTC ، وبالتالي الإيرادات ، لكل وحدة من قوة التجزئة بشكل إجمالي على الشبكة. كانت هذه الديناميكية عاملا مساهما في الخسائر الضخمة التي تكبدتها في قيمة ASICs.

كان لانخفاض الإيرادات الناتجة عن ASICs عواقب سلبية على القيم التي تم بيعها بها. شهد كل نوع من أنواع الآلات ، المصنفة حسب الكفاءة ، انخفاضا في القيمة بين 85٪ و 91٪ لكل وحدة من قوة التجزئة من قيمها العالية في الدورة إلى أسفل سعر البيتكوين في ديسمبر 2022. ونتيجة لذلك، فقدت قروض الدعم الجانبي المقدمة لعمال المناجم أكثر من 90٪ من قيمتها في بعض الحالات. لاحظ أن هذا الرسم البياني يسلط الضوء فقط على ASICs من خلال الكفاءة التي كانت الأكثر استخداما قبل وخلال السوق الهابطة ، والتي كان من المرجح أن تستخدم كضمان في القروض لعمال المناجم.

لم تكن انخفاض سعر BTC وزيادة الصعوبة الوحيدة التي واجهت قيم ASIC. كانت الآلات الجديدة والأكثر كفاءة تضرب السوق في عام 2021 و 2022، بما في ذلك أول آلة تحت 21 جيجاهاش في الثانية التي أنتجتها Bitmain في أغسطس 2022. هذا أضاف المزيد من الضغط على الآلات القديمة المستخدمة كضمان حيث أصبحت أقل جاذبية نسبيا للتعدين معها.

إدارة المخاطر
ما أزيد على أن كانت ممارسات إدارة المخاطر الضعيفة للعديد من مقرضي العملات الرقمية البارزين في ذلك الوقت من شأنها أن تجعل الأمور أسوأ. ومع ذلك، في أعقاب سوق الدب، بدأت الصناعة في تنظيم نفسها في غياب الإرشادات التنظيمية الواضحة. ويشمل ذلك إدارة المخاطر الأكثر صرامة والاستفسار الأكثر تفصيلاً. ومع ذلك، لعبت نقص إدارة مخاطر المقرض وسوء التنفيذ دورًا كبيرًا في انهيار الأصول الرقمية في عامي 2022 و 2023.
إدارة الأصول والالتزامات
لم يدير المقرضون في عصر قبل FTX سيولة كتبهم بشكل صحيح. ببساطة، كانت العديد من المجموعات تقرض على المدى وتقوم بالاقتراض لفترات قصيرة بتوقع أنها يمكنها استعادة السيولة عند الحاجة. ومع ذلك، عندما احتاج المقرضون إلى استرداد أموالهم جماعيا، لم يكن هناك ما يكفي من السيولة لتلبية الطلب. إما أن المقترضين كانوا تحت الماء بشكل كبير جدًا لإعادة رأس المال المقترض أو كانوا في قروض محددة لا يمكن للمقرضين استعادتها.
إدارة سوء الائتمان
كان إعطاء القروض غير المضمونة أو ذات الضمان الغير كافي ممارسة شائعة بالنسبة لمقرضي العملات الرقمية في عصر ما قبل FTX. يُقدر أن سليزيوس, على سبيل المثال، كان لديها حتى 36.6٪ من كتاب القروض المؤسسية الخاصة بها محتلة من قبل المقترضين غير المضمونين وBlockFiالإقراضغير مضمونة إلى FTX. كما كان لدى القرضاء إجراءات فحص غير مناسبة، حيث فشلوا في التحقق بشكل كافٍ مما إذا كانت الأطراف الآخرى مؤهلة، وقرضوا رؤوس أموال للمقترضين غير الجديرين.
ضوابط المخاطر الداخلية الضعيفة
الانقطاعات في عدم تطابق الأصول والخصوم، وإدارة مخاطر الائتمان تنحصر في ضعف ضوابط المخاطر الداخلية. كثير من المقرضين في العصر الذي سبق FTX لم يكونوا يمتلكون معايير محددة للمخاطر أو حدود مخاطر نموذجية للقروض. كانت مشكلة الضوابط الداخلية الضعيفة في الغالب متعلقة بشركة معينة وليست مشكلة صناعية واسعة. بعض المقرضين، على الرغم من أنهم أصيبوا بوباء السوق المشترك لانهيار سوق العملات الرقمية في عام 2022، كان لديهم معايير وضوابط للقروض في مكانها ساعدتهم على البقاء على قيد الحياة من خلال سوق الدب المتراجع.
ماذا يأتي لسوق الإقراض في مجال العملات الرقمية؟
الآن بعد أن بدأ السوق في الانتعاش وأصبح إعارة العملات الرقمية في ارتفاع، هناك بعض التحولات الرئيسية التي يجب مراقبتها في العام القادم. إليك بعضها:
بالنسبة إلى الإقراض في CeFi، مؤسسات تقليدية مثل كانتور فيتزجيرالد, ومقرضون رئيسيون، والبنوك التي تدخل السوق تخلق فرصًا للوصول إلى رؤوس الأموال من خلال قنوات البنوك المعتمدة، مما يزيد من التنافس ويقلل من تكاليف رأس المال. يعزز هذا التنافس المتزايد والوصول إلى رؤوس أموال بتكلفة أقل أيضًا السيولة وقابلية الوصول / حجم الخدمات، حيث تجلب هذه المؤسسات موارد مالية عميقة وبنية تحتية سوقية قوية إلى القطاع. تعتبر هذه الكيانات دخولًا إلى اقتصاد العملات الرقمية من خلال الاهتمام الفردي ونتيجة لتدابير من الجهات التنظيمية. وعلى وجه الخصوص، إلغاء مفوضية الأوراق المالية الأمريكية لـSAB-121من خلال إصدار SAB-122، يضيف الدعم لإعارة العملات الرقمية من خلال إزالة متطلب يفرض على الشركات المدرجة علنًا، وكثير من البنوك هي شركات مدرجة علنًا، حمل أصول العملاء الرقمية على أرصدتها الخاصة. كان هذا المتطلب في SAB-121، عند دمجه مع متطلبات رأس المال البنكي المنفصلة، قد جعل من الشبه مستحيل تقريبًا على البنوك تقديم خدمات حفظ العملات الرقمية، وبالتالي عرقل قدرتها على تقديم خدمات جانبية مثل الإقراض. علاوة على ذلك، أتاح ارتفاع بيتكوين ETPs في الولايات المتحدة لدخول مكاتب الإقراض الرئيسية لتوفير الرافعة المالية والإقراض مع ETPs كضمان، مما يوسع سوق الإقراض المتعلقة بالعملات الرقمية.
بالنسبة للائتمان الخاص على السلسلة القائمة على التوكن، يعتمد المستقبل على التوكينة، والقابلية للبرمجة، والفائدة، ونتيجة لذلك، توسيع العائد. توكينة الديون الخارج السلسلة تقدم عناصر من الشفافية والتشغيل التلقائي اللاتي يمكن العثور عليها في المركبات التقليدية للديون. يتيح لهذين العاملين الجمع بينهما إدارة المخاطر الأفضل وبالتالي زيادة تحمل المخاطر للمقرضين وتكاليف إدارة أقل يمكن أن تؤدي إلى أن يذهب المقرضون أبعد في منح المخاطر والتقاط المزيد من العائد المولد. بالإضافة إلى ذلك، من المرجح أن تتسع فائدة توكينات الائتمان الخاص في الاقتصاد القائم على السلسلة. من المرجح أن تكون خدمة كضمان على تطبيقات الإقراض أو لختم عملات مستقرة CDP أول حالة استخدام رئيسية لهذه التوكينات على السلسلة.
بالنسبة لإقراض DeFi ، يكمن المستقبل في توسيع قاعدة المستخدمين المؤسسية والشركات المركزية خارج السلسلة التي تبني على مجموعات التكنولوجيا لتطبيقات الإقراض. ينبع التبني المؤسسي المتزايد من 1) أصبحت الشركات المالية أكثر دراية ب blockchain ومخاطر تطبيقات onchain ، 2) الفوائد المكملة لعمليات offchain مع منافذ onchain ، 3) الوضوح التنظيمي للأصول الرقمية من الحكومات الكبرى ، و 4) قاعدة السيولة والمبلغ النسبي لنشاط الإقراض على السلسلة ينمو مقابل نشاط offchain. بالإضافة إلى ذلك ، فإن الشركات المركزية التي تعتمد على إقراض مكدسات تقنية التطبيقات أمر يجب الانتباه إليه. نظرا لأن هذه الشركات تصدر أصولا (مثل رموز الائتمان الخاصة) وتنقل المزيد من أعمالها على السلسلة ، فهناك احتمال أن ترغب في استخدام البنية التحتية ل blockchain لدعم فائدة الرموز المميزة وعمليات الشركة. مثال على ذلك هو بروتوكول Flux الخاص ب Ondo Finance ، وهو شوكة تم إنشاء إصدار Compound v2 لدعم فائدة رمز خزان OUSG الخاص به.
تحليلات مدعومة بالبيانات حول إقراض العملات الرقمية
تسلط الضوء التالي على الاتجاهات التاريخية في نشاط الإقراض على السلسلة وخارجها، بما في ذلك أسعار الفائدة، وأحجام مختلف العملات المستقرة لسي دي بي، والأصول المعظم استعارتها واستخدامها كضمان.
نشاط
الإقراض هو أكبر قطاع في مجال العملات الرقميةفئةعبر جميع سلاسل الكتل، مع إثيريوم كونها أكبر سلسلة لإقراض الأصول المودعة والمقترضة. حتى 31 مارس 2025 هناك 33.9 مليار دولار من الأصول المودعة عبر اثنا عشر سلسلة بنية على الجهاز الظاهري لإثيريوم (EVM) (L1) والطبقة الثانية (L2). هناك 2.99 مليار دولار إضافية من الودائع على سولانا، والتي لم تُبين أدناه. تحتوي إثيريوم L1 على 30 مليار دولار (81٪) من هذه الودائع. تعتبر Aave V3 على إثيريوم L1 أكبر سوق للإقراض، حيث تحتوي على 23.6 مليار دولار من الودائع حتى 31 مارس 2025. يرجى ملاحظة أن وديعات تطبيقات الإقراض تلتقط الأصول التي يتم استخدامها كضمان والأصول التي يتم وداؤها فقط لفرص توليد العائد. تغطي المزيد حول الأصول التي يتم استخدامها نشطًا كضمان على Aave V3 على إثيريوم أدناه.

يتم استخدام الرموز البيتكوين الملفوفة (WBTC، cbBTC، وtBTC)، وETH، وETH السائل (إعادة) الرهان (stETH، rETH، ETHx، cbETH، osETH، وeETH) كضمانة الأكثر استخدامًا على Aave V3 على شبكة Ethereum. بشكل إجمالي، هناك 13.5 مليار دولار من الأصول الضمانية مع الاقتراضات المفروضة بنشاط عليها. مجتمعة، هذه الأصول لديها 8.9 مليار دولار من الاقتراضات ضدها لنسبة LTV متوسطة تبلغ 65.9٪ على التطبيق.
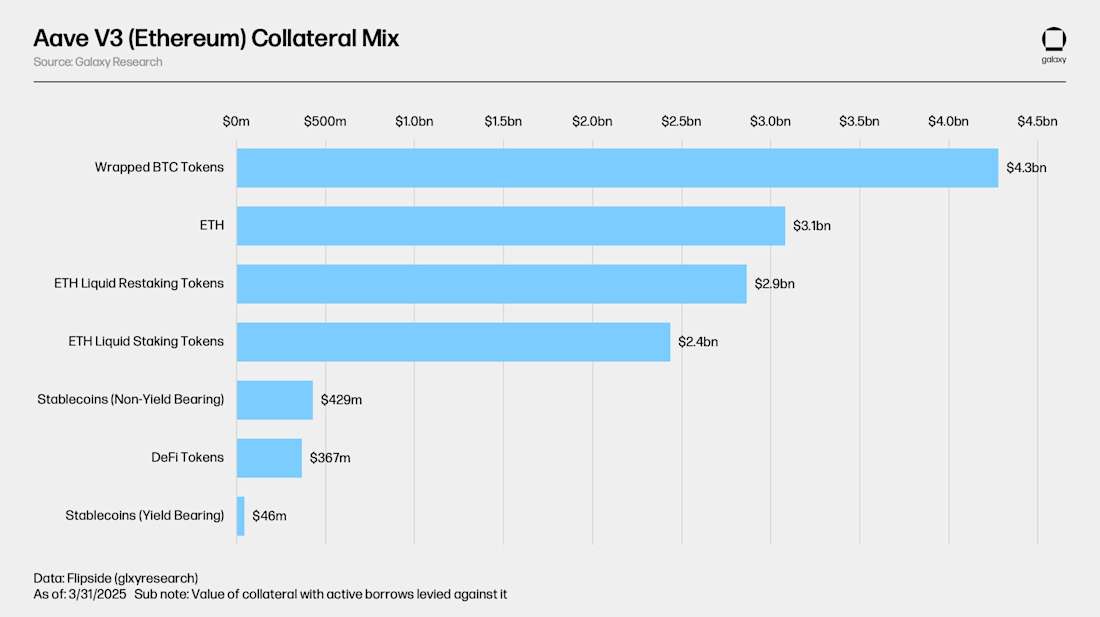
كانت القيمة المعلقة للاقتراض على نفس السلاسل الثلاثة عشر المرصودة في تحليل العرض (بما في ذلك سولانا التي تمتلك 1.13 مليار دولار في الاقتراض) 15.33 مليار دولار حتى 31 مارس 2025. يمثل هذا بشكل تراكمي معدل استخدام بنسبة 41.45٪ عبر جميع السلاسل. 8.9 مليار دولار (58٪) من الاقتراضات المفتوحة على Aave V3 على إيثريوم وحده. بلغ إجمالي مبلغ الاقتراضات المفتوحة أعلى مستوى له على الإطلاق بلغ 20.06 مليار دولار في 24 يناير 2022 عبر السلاسل EVM الاثني عشر المرصودة.

العملات المستقرة و ETH غير المرهونة هي أكثر الأصول اقتراضًا على Aave V3 على Ethereum. يرجع ذلك إلى أن العديد من المستخدمين يقومون بإيداع عملاتهم الرقمية كضمان لسيولة الدولار من أجل تمويل صفقات جديدة؛ واقتراض ETH ضد ETH المرهون (المعاد تحصيله) يتيح للمستخدمين الحصول على تعرض مرفوع لـ ETH أو قصير له بتكاليف حمل صافية منخفضة. العائد الأصلي على الرهن المدمج في الرموز السائلة (المرهونة) المعاد تحصيلها، والذي يُعبَر عنه بالـ ETH، يغطي بعض تكلفة القرض ETH في هذه الحالة. سيتم تغطية تفاصيل أكثر حول هذا، ومعدلات الفائدة الأخرى على السلسلة، أدناه.

أسعار الفائدة
تفاصيل هذا القسم تشمل أسعار الفائدة ورسوم الاستقرار المدفوعة على العملات المستقرة البارزة، بما في ذلك USDT، USDC، GHO، و DAI/ USDS، بالإضافة إلى BTC و ETH، عبر أسواق الإقراض على السلسلة والمواقع خارج السلسلة.
أسعار الفائدة Onchain
يتناول ما يلي معدلات الفائدة ورسوم الاستقرار للعملات المستقرة، والإثيريوم، و(W)BTC عبر عدد من الشبكات وأسواق الإقراض على السلسلة البيانية.
العملات المستقرة
متوسط سعر الاقتراض الوزني المجمع ورسوم الاستقرار حسب المبلغ المقترض من العملات المستقرة على الشبكة الرئيسية لإثريوم بلغ 5.67٪ باستخدام المتوسط المتحرك لمدة 30 يومًا في 31 مارس 2025. تكون أسعار الاقتراض للعملات المستقرة على السلسلة عادة ما تكون رد فعلية بشكل كبير على أسعار الأصول الرقمية مثل بيتكوين وإيثيريوم. مع تقدير قيم الأصول ، ترتفع أسعار الاقتراض عادةً ، والعكس صحيح.
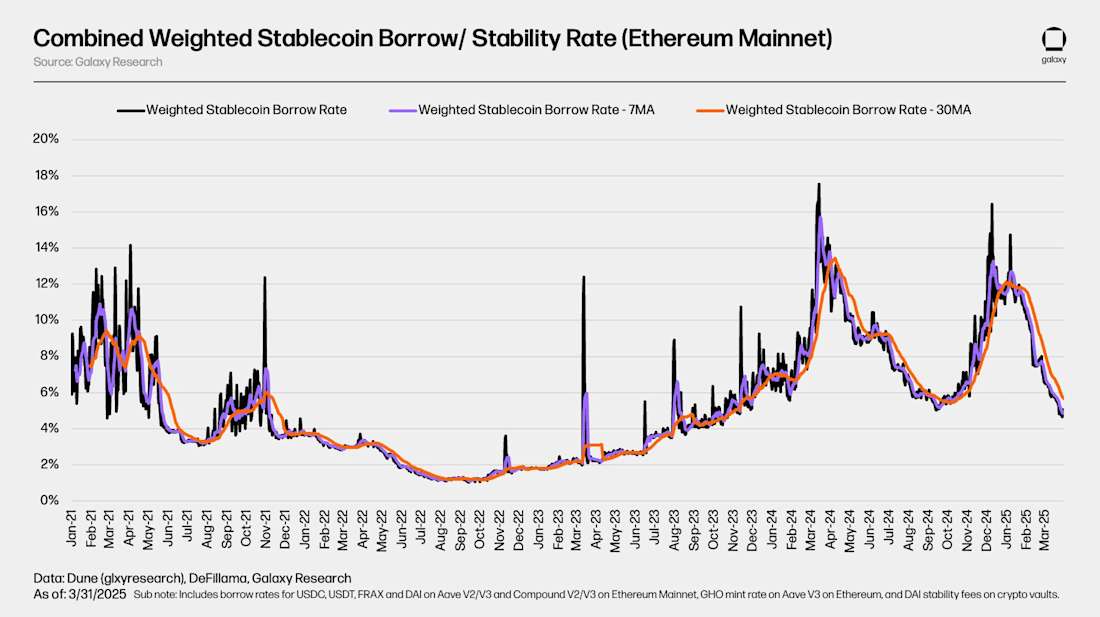
الرسم البياني أدناه يقسم سعر الفائدة على الاقتراض لعملات مستقرة على تطبيقات الإقراض، مثل Aave و Compound، ورسوم الاستقرار لعملات CDP المستقرة، مثل DAI/ USDS و GHO. يسلط الضوء على تكلفة اقتراض إيداعات LP على تطبيقات الإقراض مقابل تكلفة طباعة عملات CDP المستقرة. لاحظ عدم الاستقرار النسبي في رسوم الاستقرار لعملات CDP المستقرة مقارنة بأسعار السوق للإقراض على تطبيقات الإقراض. يعود ذلك إلى الاختلافات في كيفية تحديد أسعارها، والتي تعتمد على السوق في حالة تطبيقات الإقراض ومن خلال اقتراحات الحوكمة الدورية أو التحديثات في حالة عملات CDP المستقرة.

BTC
تُظهر الرسم البياني أدناه معدل الاقتراض الموزون ل WBTC على تطبيقات الإقراض عبر عدد من التطبيقات والسلاسل. تكون تكلفة استعارة WBTC onchain في كثير من الأحيان منخفضة بسبب نقص الطلب على الأصول. كما هو موضح سابقًا، تُستخدم العملات المشفرة الملفوفة بيتكوين أساسًا كضمان في أسواق الإقراض onchain ولا تحتفظ بمعدلات استخدام مرتفعة نسبياً تدفع تكاليف الاقتراض لأعلى. ويضاف إلى ذلك نقص التقلب في تكلفة استعارة BTC onchain التي تأتي عادة مع اقتراض العملات بشكل متكرر وسداد الديون.
في سياق الاقتراض والإقراض لـ BTC على السلسلة الجانبية ، من المهم أن نأخذ في الاعتبار أن BTC الأصلي لا يتوافق مع سلاسل الكتل التي تمكّنت من العقود الذكية ، مثل Ethereum. نتيجة لذلك ، تُستخدم رموز بيتكوين الملفوفة ، والتي في حالة Ethereum تكون عملات مستقرة ERC-20 مرتبطة بـ BTC الأصلي ، في أسواق الاقتراض على السلسلة الجانبية. يضيف هذا عنصرًا من المخاطرة إلى عملية الاقتراض والإقراض لـ BTC على السلسلة الجانبية والذي لا يتواجد دائمًا في عملية الاقتراض والإقراض لـ BTC على السلسلة الخارجية ، التي يمكن أن تتضمن BTC الأصلي.

ETH & stETH
الرسم البياني أدناه يظهر معدل الاقتراض المرجح لـ ETH و stETH على تطبيقات الإقراض عبر عدد من الشبكات. على الرغم من أن هذه الرموز تتمحور حول ETH، سواء مباشرة أو كرمز إيصال يدعي ETH تم تأمينه على شبكة Beacon Chain، إلا أن هناك فارقًا بين تكاليف اقتراضهما. يرجع ذلك إلى الاختلاف في منحنيات أسعار الفائدة الخاصة بهم ونسب الاستخدام عبر تطبيقات الإقراض. سيتم التطرق لمزيد من التفاصيل حول آليات منحنيات أسعار الفائدة في قسم لاحق يوضح تطبيقات الإقراض على السلسلة.

في أكبر سوق للإقراض على شبكة Ethereum، يتم اقتراض ETH غير المُرهون بشكل كبير بينما تعمل Ethereum LSTs كأصل رئيسي للضمان. من خلال استخدام LSTs - التي تكسب APY للرهان على الشبكة - كضمان، يؤمن المستخدمون قروضًا بالـ ETH بأسعار اقتراض صافية منخفضة، وفي كثير من الأحيان سلبية. تُغذي هذه الكفاءة التكلفة استراتيجية الحلقات حيث يستخدم المستخدمون باستمرار LSTs كضمان لاقتراض ETH غير مُرهون، يرهنوه، ثم يعيدون استخدام الـ LSTs الناتجة لاقتراض المزيد من ETH، مما يعزز تعرضهم لـ ETH APY. يُظهر الرسم البياني المصاحب التكلفة المرجحة الصافية لاقتراض ETH باستخدام stETH كضمان، المُشتقة من طرح معدلات stETH staking APR ومعدل عرض الإقراض الخاص به.

أسعار الفائدة الخارجة عن البورصة
يسلط القسم التالي الضوئ على أسعار الاقتراض الخارج على السلسلة، OTC لـ USDC و USDT و BTC و ETH، ويقارنها بأسعارها على السلسلة المقابلة.
العملات المستقرة
تتبع أسعار العملات المستقرة خارج السلسلة ، مثل أسعار العملات المستقرة onchain ، عن كثب تحركات أسعار العملات المشفرة ، وهي مدفوعة بالطلب على الرافعة المالية. على سبيل المثال ، وصلت أسعار العملات المستقرة خارج السلسلة إلى أدنى مستوياتها في صيف عام 2023 ، بعد عدة أشهر من انهيار FTX الذي تسبب في أزمة ائتمان التشفير والسوق الهابطة. منذ ذلك الحين ، ارتفعت أسعار offchain ، وتحديدا بدءا من مارس 2024 ، إيذانا ببداية السوق الصاعدة الحالية. ارتفعت أسعار Onchain ، الأكثر تقلبا بطبيعتها ، فوق 15٪ ، بينما ظلت معدلات OTC ضعيفة في نطاق 7٪ إلى 10٪. بحلول الصيف ، عادت أسعار كل من onchain و OTC إلى طبيعتها وسط حركة سعر محدودة النطاق. بشكل عام ، تميل المعدلات المستقرة على السلسلة و OTC إلى التحرك بما يتماشى مع بعضها البعض ، مع كون معدلات OTC أقل تقلبا.
لاحظ كيف تكون أسعار الـ USDC و USDT خارج السلسلة تقريبًا متساوية وتتكيف بنفس الإيقاع بينما تكون أسعار السلسلة أكثر تقلبًا وليست دائمًا متساوية. يرجع ذلك إلى الاختلافات في المخاطرة النسبية والفائدة لهذه العملات المستقرة على السلسلة مقابل الاستخدامات عبر الاقتراض خارج السلسلة وكيفية تقييم مخاطرها من قبل القرضاء خارج السلسلة.
USDC

USDT

BTC
تظهر أسعار بيتكوين انقسامًا واضحًا بين السوق اللامركزية والسوق الخارج عن البورصة. في السوق الخارج عن البورصة، يتم دفع الطلب على بيتكوين بشكل أساسي من قبل عاملين: الحاجة إلى قصير بيتكوين واستخدام بيتكوين كضمان للقروض المستقرة/النقدية. على سبيل المثال، في عام 2022، بعد انهيار FTX، ارتفعت أسعار السوق الخارج عن البورصة مع زيادة الطلب على قصير بيتكوين. بالمثل، في فبراير 2024، في بداية سوق الثيران، ارتفعت أسعار السوق الخارج عن البورصة مع سعي الشركات لاقتراض بيتكوين كضمان لتأمين قروض العملة المستقرة أو النقدية. على النقيض، ظلت أسعار بيتكوين في السوق اللامركزية في حالة ثابتة بشكل كبير. تفتقر السوق اللامركزية إلى طلب كبير، مع وجود فرص عائد قليلة متاحة، ومعظم المشاركين في السوق اللامركزية يستخدمون بيتكوين فقط كضمان للسيولة النقدية.

ETH
تعد معدلات ETH خارج السلسلة هي الأكثر استقرارا بشكل عام ، حيث يوفر العائد من تخزين ETH سعرا أساسيا يميل السوق إلى اتباعه. عادة ما تظل أسعار Onchain قريبة من عائد التخزين هذا، حيث يتم تحفيز المقرضين على الإقراض بأقل من سعر الرهان، في حين أن المقترضين لديهم حافز محدود لاقتراض ETH، نظرا لعدم وجود فرص مدرة للعائد تتفوق على التراص. في سوق OTC ، تلعب ديناميكية مماثلة ل BTC ، على الرغم من أنها أقل وضوحا. في الأسواق الهابطة ، يزداد الطلب على ETH القصير ، بينما في الأسواق الصاعدة ، يرتفع الطلب على اقتراض ETH لاستخدامه كضمان لقروض العملات المستقرة. ومع ذلك ، فإن الإقراض مقابل ETH أقل شيوعا من الإقراض مقابل BTC في مساحة OTC حيث تفضل الشركات مشاركة أصولها بدلا من النشر كضمان.

استقرار العملات الرقمية CDP
كان إجمالي إمدادات العملات المستقرة CDP البارزة 9.6 مليار دولار حتى 31 مارس 2025. DAI/ USDS، الصادرة عن Sky، هي أكبر عملة مستقرة CDP بإجمالي إمدادات قدره 8.7 مليار دولار بما في ذلك جميع أنواع الضمانات (على سبيل المثال RWA، الائتمان الخاص، والعملات المشفرة). على الرغم من الإجمالي العرضفي حين أن حجم العملات المستقرة قرب أعلى مستوياته على الإطلاق، إلا أن عملات الدين الاستقراري (CDP) لا تزال تبعد بنسبة 46% عن أعلى مستوى بقيمة 17.6 مليار دولار الذي تم تحقيقه في بداية يناير 2022.
حصة العملات المستقرة CDP من إجمالي سقف سوق العملات المستقرة أيضًا انخفضت من مستوى 10.3٪ إلى مجرد 4.1٪ حتى 31 مارس 2025. يعود ذلك إلى البارز المتزايد للعملات المستقرة المركزية، مثل USDT, والعملات المستقرة التي تحمل عائدًا، مثل USDe, بالإضافة إلى الطلب البطيء على العملات المستقرة CDP كمصدر لسيولة الدولار على السلسلة الكتلية.

الرسم البياني أدناه يظهر سقف السوق المتأمَّن بالعملات الرقمية للعملات المستقرة CDP (أي سقف السوق للعملات المستقرة CDP التي تُدعم مباشرةً بأصول تشفير). بعد أن وصل إلى 17.3 مليار دولار في يناير 2022، انخفض سقف السوق لهذه الفئة من العملات المستقرة CDP بنسبة 55% إلى 7.9 مليار دولار.
إن انخفاض سقف سوق العملات المستقرة المستندة إلى العملات الرقمية المرصودة من أعلى مستوياتها عبر سوق الدببة لعامي 2022-2023 متسق مع ذلك للقروض المفتوحة على تطبيقات الإقراض، مما يسلط الضوء على التشابهات بين وظائفها وأغراضها كمصادر للائتمان على السلسلة.

الرسم البياني أدناه يقدم رؤية غير مجمعة لرسوم استقرار عملة CDP عبر الحجرات بيتكوين وإثيريوم. إنها تمثل تكلفة ختم عملة CDP الثابتة ضد بيتكوين وإثيريوم من خلال الأماكن المراقبة. لاحظ الاختلافات في رسوم الاستقرار بين حجرات ETH و BTC على الرغم من أن الأصول تستخدم كضمان لختم نفس الأصول الاصطناعية. هذا هو عامل تمييز بعض عملات CDP الثابتة بالنسبة إلى بدائل تطبيقات الإقراض الخاصة بها، حيث تحدد الأصول الضمانية أسعار الختم بدلاً من الأصول المستعارة. يتم التطرق إلى هذا الموضوع وعملات CDP الثابتة بشكل كبير في القسم اللاحق الذي يوضح ميكانيكيات الإقراض والاقتراض عبر السلسلة.

الاشتراكلتلقي تعليقات سوق الاقتراض الشهرية مباشرة إلى بريدك الإلكتروني!
كيف تعمل إعارة العملات الرقمية من خلال DeFi و CeFi
يغطي بقية التقرير كل عمود من أعمدة التمويل المركزي واللامركزي، وكيفية عملها، والمخاطر المتضمنة، وكيف تكمل أسواق التمويل اللامركزي عمليات التمويل الخارج سلسلة الكتل.
لماذا إقراض واقتراض العملات الرقمية؟
قبل الانغماس في كيفية استعارة واقراض العملات الرقمية، دعونا نحدد لماذا تشارك الشركات والأفراد في هذا النشاط. تتضمن الأسباب ما يلي:
- الحصول على سيولة على عملاتهم - يتيح للمقترضين الوصول إلى السيولة دون بيع أصولهم، مما يحافظ على إمكانية الارتفاع في المستقبل.
- الحصول على عائد على عملاتهم – يسمح للمقرضين بكسب فوائد سلبية على أصولهم الخاملة.
- احصل على رافعة مالية للتداول - يمكن للأفراد تكبير حجم موقعهم من خلال التداول بالأموال المستعارة.
- تحويط التعرض الطويل - يمكن للأفراد التقليل من المخاطر على المراكز الطويلة القائمة عن طريق إنشاء مواقف قصيرة معاكسة، مما يدير بشكل فعال دلتا المحفظة ويقلل من التعرض الاتجاهي.
- الحصول على تعرض قصير - يمكن للتجار أن يأخذوا مواقع بناءً على انخفاضات الأسعار المتوقعة عن طريق استعارة وبيع الأصول التي يتوقعون إعادة شرائها لاحقًا.
- عمليات تمويل الأعمال - تتيح للشركات الوصول إلى سيولة يمكن استخدامها لتمويل العمليات.
بناءً على السبب الخاص للاقتراض / الإقراض، يمكن أن تؤثر الأصول التي يمتلكها المقترض أو الدائن وأماكن احتفاظهم بها، وكم من رأس المال يتطلعون للاقتراض أو الإقراض على أفضل قناة للاستخدام.
إعارة CeFi
يمكن تقسيم إعارة CeFi إلى ثلاث فئات، سوق العدسات (OTC)، وساطة رئيسية، وائتمان خاص على السلسلة.
الإقراض خارج البورصة
يسلط ما يلي الضوء على تفاصيل مستوى عالٍ لإقراض CeFi OTC:
كيف يعمل النظام؟ يواجه الأطراف المعنية بعضها البعض في اتفاقيات ثنائية. يتم التفاوض على كل صفقة وتوثيقها بشكل منفصل وعادة ما يتم ذلك عبر الصوت أو الدردشة (على سبيل المثال، عبر المكالمات الهاتفية أو مكالمات الفيديو، أو عبر البريد الإلكتروني أو تطبيقات المراسلة). وغالبًا ما يتم الاحتفاظ بضمانات المقترض الرقمية في السلسلة الكتلية.التوقيع المتعدديتم التحكم فيها من قبل القرض. في بعض الحالات حيث يتم ترتيب اتفاقيات ثلاثية الأطراف، قد يتحكم المقترضون والمقرضون والعهدة في مفاتيحهم الخاصة إلى التوقيع المتعدد.
من يقدمها ويستخدمها؟ يتضمن بعض المقرضين الرئيسيين للتداول خارج البورصة في هذا المجال شركة Galaxy و Coinbase في الولايات المتحدة؛ تقدم بورصات كبيرة أخرى على مستوى العالم خدمات مماثلة. وعادةً ما يكون المقترضون صناديق التحوط والأفراد ذوي الثروات العالية ومكاتب العائلات والمنقبون وغيرهم من الشركات المتعلقة بالعملات الرقمية أو الشركات المجاورة لها التي تلبي متطلبات المشارك العقد المؤهل (ECP).
ما هي حالات الاستخدام للأموال المستعارة؟ بمجرد تنفيذ القروض، يكون المقترضون عادةً حرين في القيام بما يرغبون فيه من عائدات القرض. تشمل بعض الاستخدامات الشائعة التداول بالرافعة المالية، تمويل العمليات، أو إعادة تمويل قروض أخرى.
تفاصيل أخرى حول الإقراض خارج البورصة: يستخدم بعض المقرضين خارج البورصة تطبيقات على السلسلة البلوكية لتعزيز أعمالهم. وهذا يعود بالفائدة على شفافية ومحاسبة سجلاتهم المالية، وقدرتهم على العمل على مدار الساعة وطوال أيام الأسبوع، والتصفية وأي إجراءات محددة مسبقًا، وبناء منتجات على البنية التحتية المجانية والمفتوحة.
القروض الخارجية للأفراد والشركات الصغيرة: بينما تعتبر النشاط على مستوى المؤسسات من أهم الدوافع لسوق التمويل خارج البورصة، إلا أن الأفراد والشركات الصغيرة يشاركون أيضًا في هذا المجال. تقدم بعض الجهات المقرضة في سيفي، مثل ليدن، وأنشيند، وآرش، خدمات للأفراد الراغبين في استخدام عملاتهم الرقمية كضمان لأنشطة مثل شراء المنازل وبدء الأعمال التجارية. يتم حظر هذه الفئة من العملاء في كثير من الأحيان من الخدمات المالية في البنوك التقليدية، التي، حتى الآن، لا تقبل الأصول الرقمية كأشكال ضمان. ونتيجة لذلك، تعمل هذه الجهات المقرضة كحبل نجاة لهذه الفئة من المقترضين الذين غالبًا ما يمتلكون أصولًا رقمية ولكن ليس بالضرورة بالعملة القانونية.
الوساطة الرئيسية
التالي يسلط الضوء على تفاصيل عالية المستوى لأعمال وسطاء السيفي التقليدية الرئيسية:
كيف يعمل الأمر؟ يمكن للشركات الحاصلة على حسابات في الوسطاء الرئيسيين أن تتخذ مواقف اتجاهية على صناديق الاستثمار المتداولة في البورصة للعملات الرقمية. تقتصر صناديق الاستثمار المتداولة في البورصة على نوع ومصدر، حيث يتم قبول صندوق الاستثمار المتداول في البورصة بالبيتكوين فقط من قبل مجموعات محددة كضمان مقبول. عادة ما يكون هناك متطلبات هامش تبلغ 30-50% فقط للحفاظ على الموقف مفتوحًا. يكون المواقف عادة ما تخضع للتقييم اليومي ومتطلبات الهامش الإضافي التي تتم يومياً.
من يقدم / يستخدمها؟ تقدم متاجر مثل Fidelity و Marex و Hidden Road خدمات وساطة رئيسية تقليدية على صناديق الاستثمار المتداولة بالعملات الرقمية.
ما هي حالات الاستخدام للأموال المستعارة؟ عادة ما تُستخدم للتداول أو لتمويل المراكز ذات الأجل القصير (بدون تحديد مدة).
مجال العملات الرقمية Prime
الخدمات الرئيسية المماثلة المقدمة على صناديق الاستثمار المتداولة بالعملات الرقمية متاحة أيضًا على عملات رقمية فورية. ومع ذلك، توفر عدد قليل من الأماكن، مثل كوين بيس برايم وهيدن رود، هذه الخدمات. تم إعداد خدمات وسيط العملات الرقمية الفورية الرئيسية بشكل مماثل لتلك الخدمات التقليدية على صناديق الاستثمار المتداولة بالعملات الرقمية، مع الفارق الرئيسي يتمحور حول متطلبات الهوامش الأكثر تحفظًا ونسبة القرض إلى القيمة (LTV).
Onchain الائتمان الخاص
يسمح الائتمان الخاص Onchain ، الذي ارتفعت شعبيته إلى حد كبير في عام 2021 ، للمستخدمين بتجميع الأموال onchain ونشرها من خلال اتفاقيات وحسابات خارج السلسلة. في هذه الحالة ، تصبح blockchain الأساسية بشكل فعال منصة تعهيد جماعي ومحاسبة للطلب خارج السلسلة على الائتمان. كانت شركات cDeFi هي الميسرين الأساسيين لهذه الأنواع من القروض ، حيث تدير كلا من نهايات سلسلة وخارج السلسلة لدورة حياة القرض - غالبا مع شركاء خارج السلسلة. يتضمن جانب onchain من العمل إطلاق العقود الذكية ، وتصميم الرموز المميزة لكل قرض ، وتشغيل البنية التحتية اللازمة لدعم تطبيق onchain. يشمل الجانب الخارجي من العمل جذب المقترضين ، وإنشاء القناة القانونية اللازمة لجمع الأموال على السلسلة ، ووضع الإجراءات والبنية التحتية اللازمة لنقل الأموال داخل / خارج السلسلة.
استخدام صافي العائدات عادة ما يكون ضيقًا وقد تباين من تمويل الشركات الناشئة إلى قروض جسور العقارات وصناديق السندات الخزانة، مع استعداد شروط القروض على أساس المقرض إلى المقترض. تاريخيًا، استخدام العملات المستقرة كان يستخدم في الأساس في هذا التطبيق. يقدم مكون offchain لهذه المنتجات مخاطر فريدة حول قابلية التدقيق وشفافية صافي القروض التي تم جمعها onchain وأداء القرض نفسه. كان هذا مشكلًا في بعض الحالات، حيث يقوم المقترضون اساءه استخدامتوجيه عائدات القرض لأغراض تتجاوز نطاق اتفاقية القرض بسبب نقص وصعوبة مراجعة الأموال خارج السلسلة.
الائتمان الخاص وضمان العملة المستقرة
تم تطبيق الائتمان الخاص Onchain بشكل فريد في DeFi كضمان للعملة المستقرة التي تحمل عائدا ، حيث تدعم الديون والفوائد خارج السلسلة العملة المستقرة onchain. وقد تم ذلك بشكل شائع بين Sky و Centrifuge ، وهي جهة إصدار للائتمان الخاص وأصول العالم الحقيقي (RWA). خصصت Sky جزءا من DAI / USDS للمخصصين على أجهزة الطرد المركزي الذين استخدموا العملات المستقرة في منتجات الائتمان المهيكلة خارج السلسلة مع تصنيفات من الدرجة الاستثمارية والتمويل العقاري وتطبيقات أخرى. ثم دفع المخصصون المبلغ الأساسي ل DAI الصادر لهم ، بالإضافة إلى الفائدة التي اكتسبتها في اتفاقية الديون خارج السلسلة ، إلى بروتوكول Sky. لا يختلف هذا النموذج لدعم الأصول على السلسلة بديون خارج السلسلة عن النموذج التقليدي للعملات المستقرة لمركز الديون المضمونة (CDP) ، حيث تعمل ديون onchain كضمان مستقر. يتم تغطية المزيد عن الإقراض عبر السلسلة والعملات المستقرة CDP في الأقسام التالية ؛ وهذا البحث غالاكسي تقريريغطي أيضًا تقاطع الائتمان الخاص و DeFi بمزيد من التفاصيل.
قرض ديفي
بعض منتجات الإقراض والخدمات التي توجد من خلال قنوات خارج السلسلة توجد أيضًا كتطبيقات عقود ذكية غير المرخص لها. ولاحظ أن تطبيقات الإقراض مثل Aave ومواقع الإصدار المستقرة لمواقع الإصدار المستقرة (CDP) مثل Sky تتيح للمستخدمين الاقتراض ضد أصولهم على السلسلة. وتسمح وسائل بديلة للحصول على ائتمان على السلسلة، مثل dexes perps، للمستخدمين بالوصول إلى الأموال للاحتياجات المخصصة، مثل التداول برافعة مالية. بينما تُقدم خدمات مماثلة، فإن الطبيعة على السلسلة لتطبيقات الإقراض والحصول على وسائل أخرى للحصول على ائتمان على السلسلة تمنح القناة مجموعة من الاختلافات الرئيسية عن بدائلها المركزية خارج السلسلة. يسلط الجدول أدناه الضوء على ما تبدو عليه بعض هذه الاختلافات:

كيف تعمل الاقتراض في ديفي؟
وظائف الإقراض والاقتراض DeFi مماثلة لتلك الخاصة بالإقراض والاقتراض المضمون خارج السلسلة. تعتمد الاختلافات الأساسية على 1) إقراض DeFi الذي يعمل برمجيا من خلال العقود الذكية التي تفرض مجموعات محددة مسبقا من المعلمات بدلا من العمليات الموجهة بشريا ، 2) حيث يتم الاكتتاب في مخاطر المقترض ، و 3) حيث يتم تطبيق تدابير تعويض المخاطر (مثل عائد المقرض ومكافآت المصفي).
المعلمات، التي تشمل مكونات مثل منحنيات أسعار الفائدة، نسبة القرض إلى قيمة الرهن، وعتبات التصفية، بين أمور أخرى، مصممة على مستوى الأصول. تُستخدم لإدارة المخاطر، وبناء الحوافز، ولتعزيز الكفاءة القصوى لأسواق الإقراض.
وسائل حماية المخاطر من خلال معلمات الأصول تعني وجود اختلافات في المكان وكيفية كتابة المخاطر في نهاية المطاف بين الإقراض داخل السلسلة وخارجها. مع الإقراض خارج السلسلة، يتم كتابة المخاطر من خلال مكونات مثل LTV وأسعار الفائدة على أساس لكل المقترض، مع مراعاة تاريخ المقترض والضمان / الأصول المستعارة ومدة القرض. بالمقابل، في الإقراض داخل السلسلة، تعتمد تقييم المخاطر للقرض المعطى فقط على توافق الضمان / الأصول المستعارة. وهذا يعني أن كل مقترض يستخدم نفس الضمان والأصول المستعارة يحمل قروض متطابقة من ناحية LTV وأسعار الفائدة وجميع المعلمات الأخرى. هذا لأن المستخدمين، وقدرتهم على سداد الأموال المستعارة، ومدة القرض ليست تهديدًا لوجود التطبيق أو رأس المال للمقرضين. بل الضمان الذي يقدمونه والأصول التي يستعيرها هي التهديد الوجودي، حيث تجعل تصفية الضمان المقرضين والتطبيقات كليًا في حالة تضرر القرض.
كل معلمة، التي تكون شفافة تمامًا ومعروفة مسبقًا، تلبي أحد أو أكثر من الخطوات الثلاثة لسير تداول العملات الرقمية غير المركزية:
- إيداع الضمان الأصول
- تحديد الأصول المعارة
- سداد القروض والتصفيات
يتناول ما يلي نظرة أقرب على دورة حياة القروض DeFi من خلال منظور معلمات الأصول وتدابير إدارة المخاطر التي تحكمها.
إيداع الأصول الضمانية
تقريبًا جميع أنشطة الاقتراض في ديفي مرفوعة بضمان زائد. هذا يتطلب من المستخدمين تقديم الأصول التي يمكنهم اقتراضها. يتم قفل هذه الودائع على التطبيق لمدة القرض ويتم إقراضها للمستخدمين المقترضين، مما يزيد من كفاءة جميع رؤوس الأموال المودعة على التطبيق. اختيار مستخدم لأصول الضمان يحدد معلمات مثل1] [2] [3، والتي تختلف من حيث الأصول
- APR التوريد - العائد الذي يحققه المستخدمون على الضمانات التي يقومون بإيداعها، وهو دالة لسعر الاقتراض. العائد الذي يتم توليده من هذه الودائع هو الفائدة التي يدفعها المقترضون. هذا العائد بالإضافة إلى العائد الأصلي لأصول الضمان الموردة (على سبيل المثال، عائد الرهن على stETH). كلما تصور التطبيق أن الأصل أكثر خطورة، كلما زاد APR التوريد بالنسبة إلى معدل استخدامه. يتم ذلك لتعويض الموردين عن الخطر الذي يتحملونه وإدارة الخطر لتطبيقات على جانب الاقتراض/السيولة من وظيفتها.
- نسبة القرض إلى القيمة (LTV) - هو الحد الأقصى للقيمة النسبية التي يمكن للمستخدم استعارتها ضد رهنهم. على سبيل المثال، إذا كان لديك أصول رهنية بنسبة LTV تبلغ 50٪، يمكن للمستخدم أن يستعير ما يصل إلى 50 سنتًا لكل دولار من الرهن المودع. كلما كانت نسبة LTV لأصل رهني معين أقل، زادت المخاطرة التي تعتبرها التطبيق، والعكس بالعكس.
- الحد الأدنى للتصفية - LTV الذي يعتبر فيه إقراض المستخدم غير مكفول ويتم تصفية كفالتهم وتوزيعها مرة أخرى على القرضاء / المصفين. يكون الحد الأدنى للتصفية دائمًا أعلى من LTV الأقصى. وعادةً ما يكون هناك علاقة مباشرة بين تقلبات الأصول الكفالة ومخاطرها والفارق بين أقصى LTV والحد الأدنى للتصفية. يتم ذلك لإنشاء وسادة أمان لحماية ضد التصفية الفورية عند الاقتراض بحد أقصى لنسبة LTV.
- غرامة التصفية - معبرا عنها كنسبة مئوية من مبلغ الأصول التي تمت تصفيتها ، وغرامة التصفية هي مكافأة إضافية تدفع للكيانات التي تقوم بتصفية ضمانات المستخدمين. يشار إلى عقوبة التصفية أيضا باسم "انتشار التصفية" لأنها تمثل النسبة المئوية للخصم الذي يمكن للمصفين شراء ضمانات المستخدم به. على سبيل المثال ، إذا كان لدى المستخدم ضمان قابل للتصفية بقيمة سوقية قدرها 100 دولار بغرامة قدرها 5٪ ، فيمكن للمصفي شرائه مقابل 95 دولارا ، وبيعه بالقيمة السوقية ، وجيب الفرق. عادة ما تقتطع تطبيقات الإقراض رسوما من مكافأة المكافأة. تستخدم بعض تطبيقات الإقراض المزادات بدلا من عقوبات التصفية المشفرة ، مما يسمح للسوق بتحديد الخصم المناسب. كلما ارتفعت عقوبة التصفية لأصل الضمان ، زادت خطورة الطلب التي يتصورها. يتم ذلك لتحفيز تصفية الضمانات بشكل كاف والحد من إمكانية الديون المعدومة.
- حدود الإمدادات - تحدد الأصول الرهنية على بعض تطبيقات الإقراض حدود الإيداع الصعبة التي تقيد عمدًا تعرضها لها. يمكن لحد الإمدادات تقييد مقدار الأصل الرهني المعطى الذي يمكن للمستخدم إيداعه. يمكن أن يكون حد الإمداد منخفضًا بسبب ملف مخاطر الأصل، حيث تحد التطبيق من تعرضه له. كما يمكن أن يكون إشارة إلى أن الأصل لديه قيمة سوقية صغيرة نسبيًا وأن التطبيق لا يرغب في أن تكون أكثر من نسبة معينة من قيمته الإجمالية مودعة عليه.
- وزن الضمان ومضاعفات LTV - عامل يطبق على قيمة ضمان المودع الذي يخنق مدى إمكانية استخدامه لأغراض تخفيف المخاطر أو يخوله الحصول على نسب LTV القصوى المعززة ، وبالتالي عتبات التصفية. الأصول التي ينظر إليها على أنها أكثر خطورة من قبل التطبيق لها وزن أقل من 1 لتطبيق حاجز بين قيمتها السوقية والحصة التي يمكن استخدامها للاقتراض مقابلها. على سبيل المثال ، ضمانات بقيمة 100 دولار والتي يبلغ وزنها .85 لها قوة اقتراض تبلغ 85 دولارا يتم تطبيق الحد الأقصى ل LTV عليها. الضمانات <> اقتراض أزواج الأصول التي يجد طلب الإقراض أن لها ارتباطات عالية القيمة (مثل اقتراض ETH مقابل Ethereum LST) تخول المستخدمين الحصول على نسب LTV قصوى تفضيلية لأنه من غير المرجح أن ترتفع أصول الضمان والاقتراض أو تنخفض قيمتها بسرعة مقابل بعضها البعض. لا تتوفر مضاعفات LTV وأوزان الضمانات إلا على أصول محددة ولا تستخدمها جميع تطبيقات الإقراض.
- حالة العزل - الأصول ذات حالة العزل لا يمكن أن تتم إقرانها مع أصول رهن أخرى لتمويل القروض. بالإضافة إلى ذلك، يمكن استعارة الأصول الرهنية في وضع العزل فقط للسقف الديني المحدد ووضع حد لمدى استعارتها. في حالات أخرى، تعني حالة العزل أن يمكن استعارة الأصل فقط، وعند الاقتراض، لا يمكن استعارة أصول أخرى في محافظ المستخدمين. في التطبيقات التي تستخدم وزن الضمانات، تحظى الأصول المعزولة بوزن يساوي 0. يُستخدم عزل الأصول كأداة لإدخال الأصول الشابة أو العرضية في تطبيق الإقراض بطريقة تخفيف المخاطر. كما يتيح للتطبيقات استضافة مجموعة أوسع من الأصول مع تعويض المخاطر المرتبطة بذلك.
مجموعة المعلمات المحددة التي تحكم أصل الضمان وقيمها الدقيقة تختلف حسب التطبيق والسلسلة والأصل. على سبيل المثال، USDC على Aave V3 على شبكة OP الرئيسيةلديها معلمات مختلفة عن USDC علىإيثيريومنظرًا لأنهما رمزان متميزان (يحملان عنوان عقد رمز مختلف على سلاسل مختلفة) موجودان في نظم بيئية متميزة. ويستخدم MarginFi على سولانا أوزان الضمان لإدارة المخاطر بينما لا يفعل Aave.
يتم فرض كل من هذه المعلمات خوارزميا وتختلف فقط من خلال مجموعات من أصول الضمان / الاقتراض. أي أن جميع الإجراءات من وجهة نظر التطبيق ، ولا سيما إنفاذ المعلمات والمحاسبة اللازمة للقيام بذلك ، وتوزيع عوائد الضمانات ، تتم بشكل مستقل من خلال العقود الذكية ؛ وكل مستخدم يودع نفس أصل الضمان / يقترض نفس الأصل يخضع لنفس المعلمات المحددة مسبقا حوله. لا يتم استخدام درجات الائتمان والجدارة وغيرها من التدابير خارج السلسلة للحصول على القروض ، لأن الطلبات نفسها غير متفقة ولا تتطلب سوى إيداع الضمانات من أجل الاقتراض. ينطبق نفس المبدأ على الأصول المقترضة. ومع ذلك ، يمكن للشبكات الموجودة عليها التطبيقات إدخال عناصر الرقابة ، وإن كان ذلك من خلال عوامل لا علاقة لها بإقراض DeFi نفسه (مثل عقوبات مكتب مراقبة الأصول الأجنبية).
يتم تقييم "جودة" ومخاطر أصل الضمان الأساسي الذي يحدد قيم المعلمات الخاصة به من خلال عدد من العناصر ، بما في ذلك على سبيل المثال لا الحصر ما يلي [1] [2]:
- سيولة الأصول / عمق السوق ووقت استعادة عمق السوق
- تقلب سعر الأصول
- حجم سوق الأصول
- مخاطر الطرف الثالث (كيف ومن يدير الأصول)
- مخاطر العقد الذكي (سلامة الكود الذي يدعم الأصل)
- سعة تنفيذ المصفي (مدى سرعة المصفيين المعينين يمكنهم تصفية الأصول)
- ثقة المهتمين في الأسعار التي يخصصونها لأصول الضمان
يحدد مخاطر أصول الضمان المماثلة التي وضعتها تطبيقات الإقراض المعطاة أيضًا معلمات الأصول المستعارة، والتي ستتم تغطيتها في القسم التالي.
اختيار الأصول المستعارة
بعد أن يقوم المستخدم بإيداع الضمان، يمكنه اختيار الأصول التي يمكنه استعارتها. تم تعيين بعض أزواج الضمان والاقتراض كأسواق (على سبيل المثال، مركبV3 وLido لـ Aaveالأسواق) لأغراض تخفيف المخاطر حيث يمكن استخدام الضمان المقدم فقط لاقتراض أصل واحد أو مجموعة محددة من الأصول في حمامات معزولة. وبعضها يمتلك نطاقًا حرًا حيث يمكن استخدام أي أصل ضمان لاقتراض أي أصل على التطبيق. المقترضون يمكنهم استخدام الأصول المقترضة لأي غرض والاستيلاء على ملكيتها الكاملة. الأصل الذي يقترضه المستخدم يحدد أي تركيبة من هذه العناصر الأربعة:
- اقتراض APR (سعر الفائدة) - التكلفة السنوية الاسمية لاقتراض أصل معين. يتم تقسيم الفائدة التي يدفعها المقترضون بين طلب الإقراض (في شكل عامل احتياطي) والمستخدمين الذين أودعوا الأصول المقترضة (في شكل معدل الفائدة السنوية للتوريد). في بعض التطبيقات ، يكون لدى المستخدمين خيار القروض ذات السعر المستقر ، حيث يكون سعر الفائدة الذي يدفعونه هو معدل ثابت على المدى القصير ولكن يمكن إعادة توازنه على المدى الطويل استجابة للتغيرات في ظروف السوق ، والقروض ذات السعر المتغير ، حيث يتقلب سعر الفائدة الذي يدفعونه في الوقت الفعلي مع السوق. الغالبية العظمى من القروض على السلسلة هي قروض ذات معدل متغير حيث أن معدل الاقتراض الثابت عادة ما يكون أعلى بكثير من المتغير وبعض التطبيقات لا تقدم معدلات ثابتة. يدفع جميع المستخدمين الذين يقترضون نفس الأصل نفس سعر الفائدة ، والذي يتم تحديده من خلال المخاطر المتصورة للتطبيق للأصل المقترض وطلب السوق عليه. تتم برمجة منحنيات الاقتراض لتكون أعلى على الأصول التي يرى التطبيق أنها أكثر خطورة ، والعكس صحيح. تستخدم تطبيقات الإقراض تقييم المخاطر الأساسي لأصل معين لتحديد منحنيات أسعار الفائدة.
- عامل الاحتياطي - نسبة الفائدة التي يدفعها المقترضون وتوزع مرة أخرى إلى تطبيق الإقراض، وDAO (المنظمة اللامركزية الذاتية) الخاص به، أو الأموال الأخرى التي يحتفظ بها التطبيق. يُعبَّر عنه كنسبة مئوية من الفائدة التي يدفعها المقترضون.
- وزن المسؤولية - عامل يُطبق على قيمة ضمان الوديعة للحد من مدى اقتراضها ضد الضمان المقدم. على سبيل المثال، فإن قيمة 100 دولار من الأصول المقترضة التي لها وزن مسؤولية قدره 1.15 لها قيمة اقتراضية قدرها 115 دولار تُطبق على نسبة القيمة إلى القرض. يُستخدم هذا كأداة للتخفيف من المخاطر للأصول المقترضة التي يُعتقد أنها تشكل خطرًا على تطبيق الإقراض.
- حدود الاقتراض - أصول الاقتراض في بعض طلبات الإقراض لها حدود صارمة تخنق عمدا تعرضهم لها ؛ ويتم ذلك لأغراض إدارة السيولة والتخفيف من حدة الإعسار. يمكن أن يحد سقف الاقتراض الثابت من مقدار أصل معين يمكن للمستخدم اقتراضه إذا لم تكن السيولة وفيرة بما فيه الكفاية. تحتوي التطبيقات الأخرى على حدود اقتراض "ناعمة" حيث تكون حدود الاقتراض ملزمة فقط بمقدار الأصل المقدم إلى البروتوكول. في هذه الحالات ، يدعم البروتوكول كمية غير محدودة من إمدادات الأصول والاقتراض ، ولكن لا يمكن للمستخدمين الاقتراض إلا إلى الحد الذي يتم فيه توفير الأصول ، والسيولة المتاحة. عادة ما تكون الحدود القصوى للاقتراض الثابت أقل من حدود العرض المقابلة لها ولا يمكن أن تكون أعلى أبدا. لاحظ أن الحدود القصوى للاقتراض يتم تطبيقها عادة على مستوى العالم وليس على أساس مستخدم إلى مستخدم (أي يمكن لمستخدم واحد اقتراض ما يصل إلى 100٪ من السيولة المتاحة للأصل أو اقتراض سقف إذا كان لديه الضمان للقيام بذلك ، لا تحد التطبيقات عادة من حجم الاقتراض الواحد).
كل هذه المكونات تعتمد على تقدير التطبيق المقترض لمخاطر الأصول المستعارة، ومستويات السيولة المستهدفة وتوليد الدخل النسبي للمقرضين والتطبيق نفسه، واستراتيجيته لتحديد تكاليف القروض مقابل تطبيقات المنافسين في نفس السوق. تختلف مخاطر أصول الاقتراض والمجموعة المحددة من المعايير التي تحكمها، وقيمها الدقيقة حسب التطبيق، والشبكة، والأصل.
حساب معدلات الفائدة على السلسلة
هناك اثنين من المداخل الرئيسية التي تدخل في دفع أسعار الفائدة التي يدفعها المقترضون onchain: 1) الاستخدام والأسعار الأمثل و2) حساب منحنى أسعار الفائدة. تختلف كل من هذه العناصر حسب الأصول وتطبيق الإقراض. على سبيل المثال، السعر الأمثل ومنحنى أسعار الفائدة ل WBTC على Aave V3 على إيثيريوم مختلف عن ذلك لـ USDC؛ ومنحنى أسعار الاقتراض لـ USDC على Aave v3 علىإثيريوممختلف عن تلك المتاحة في Aave V3 على USDC على Gate.ioشبكة أوب الرئيسية.
الاستخدام والأسعار الأمثل
معدل استخدام أسواق الإقراض onchain هو تعبير عن السيولة النسبية للأصل داخل التطبيق. غالبا ما يتم حسابه على أنه الطلب / العرض ، حيث يكون الطلب هو مقدار الأصل المقترض والعرض هو مقدار الأصل المودع في البروتوكول (بما في ذلك الضمانات المودعة من قبل المقترضين). السيولة الصريحة للأصل المعبر عنها إما بالدولار أو بالوحدات المحلية هي ببساطة العرض - الطلب. في بعض الحالات ، سيشمل جانب العرض من هذه الحسابات احتياطيات أو عوامل أخرى فريدة لبروتوكول معين. نتيجة لذلك ، يعد معدل الاستخدام المرتفع علامة على انخفاض السيولة النسبية حيث يتم اقتراض المزيد من الأصول مع بقاء عدد أقل في طلب السحب والتصفية والاقتراض الإضافي ، والعكس صحيح. يستخدم معدل الاستخدام لتحديد سعر الفائدة الدقيق الذي يدفعه المستخدمون على طول منحنى سعر الفائدة للأصل ، حيث كلما ارتفع معدل الاستخدام كلما ارتفع سعر الفائدة. يتقلب سعر الفائدة المدفوع أيضا في الوقت الفعلي مع تغير العرض والطلب. يمكن أن تحدث التغييرات في أسعار الفائدة بزيادات قصيرة مثل الفاصل الزمني لكتلة الشبكة (الوقت بين إضافة كتل جديدة إلى السلسلة) أو التكرار الذي يقوم به المستخدمون بتوريد / سداد الأصول واقتراضها.
يحدد المعدل الأمثل أو معدل الالتواء (يظهر أحيانا كنقطة شبك) ، وهو معدل الاستخدام الذي بعده ينحدر منحنى السعر ويتغير حساب سعر الاقتراض ، ميل منحنى الاقتراض وهو معدل الاستخدام المستهدف (أو السيولة النسبية وهدف سعر الفائدة) لأصل معين. الأصول الأكثر تقلبا وغير السائلة لها معدل مثالي أقل ، وتستهدف استخداما أقل ، لضمان السيولة الكافية في التطبيق. يصبح منحنى الاقتراض أكثر حدة عندما > معدل الاستخدام المعدل الأمثل لتحفيز الودائع وسداد القروض (زيادة العرض وخفض الطلب) وتثبيط القروض الجديدة (الحد من صافي الطلب الجديد) ، مما يؤدي إلى انخفاض معدل الاستخدام نحو المعدل المستهدف. يصبح منحنى الاقتراض أكثر تسطحا عندما يكون معدل الاستخدام < المعدل الأمثل لتحفيز الاقتراض ورفع الاستخدام نحو السعر المستهدف دون دفع أسعار الفائدة إلى ارتفاع شديد مع القروض الإضافية الجديدة.
حسابات ميل سعر الفائدة
كل طلب للإقراض لديه معادلة فريدة لتحديد أسعار الفائدة التي تختلف حسب مخاطر الأصول المعتقدة ونوع الأصول1], ولكنها جميعًا متأثرة بالاستخدام والأسعار الأمثل وتصبح أكثر انحدارًا بعد تجاوز الاستخدام الفعلي للسعر الأمثل. ومن غير الشائع أن تحتوي طلبات الإقراض على عدة منحنيات لأسعار الفائدة لكل نوع من الأصول لتعويض الطيف الكامل لمخاطرها. على سبيل المثال، يمكن لتطبيق أن يحتوي على منحني سعر فائدة منخفض ومنحني سعر فائدة مرتفع لعملات الدولار المستقرة اعتمادًا على كيفية رؤيته لمخاطر كل منها. وفيما يلي بعض المعادلات الأساسية المستخدمة لبناء منحنيات أسعار الفائدة لبعض طلبات الإقراض:

هذه معادلات معدل الاقتراض تأخذ الشكل العام للمنحنى المثالي أدناه. لاحظ كيف يتم التعبير عن الميل أعلاه وأسفل السعر الأمثل كخطوط متميزة. هذا لأن معادلات الميل المختلفة تستخدم لحساب كل منها.

إن الجمع بين الأرجل المسطحة والأكثر انحدارا لمنحنى سعر الفائدة جنبا إلى جنب مع معدلات الاستخدام الأمثل يخلق آلية ذاتية التعديل تدير بشكل مستقل سيولة البروتوكول النسبي / دخل المقرض وكفاءة رأس المال للودائع من خلال القوى المدفوعة بالحوافز. يتم الحفاظ على سيولة البروتوكول ودخل المقرض من خلال الحصة المستهدفة من الأصول المودعة التي يتم اقتراضها (السعر الأمثل) والتي يتم فرضها من خلال منحنى سعر الفائدة الديناميكي. الأصول ذات المخاطر العالية لنقص السيولة سيكون لها منحنيات شديدة الانحدار تتجاوز المعدل الأمثل للتعويض بشكل كاف عن هذه الديناميكية. نتيجة لذلك ، فإن أسعار الفائدة هي إدارة السيولة ، وتعويض المخاطر ، وأدوات إدارة كفاءة رأس المال في الإقراض على السلسلة. تستخدم جميع المعلمات الأخرى لموازنة تعرض التطبيق لأصل معين ، والحد من إمكانية تراكم الديون المعدومة ، والتخفيف من عدم القدرة على تصفية ضمانات المستخدم (أو القيام بذلك على حساب المستخدم المقترض أو أموال المقرض) ، من بين إدارة المخاطر الأخرى.
سداد القروض والتصفية
الخطوة النهائية في سير عمل الإقراض على السلسلة هي سداد القروض و، في أسوأ الحالات، التصفية.
سداد الديون
يتم سداد كل الديون بالأصول التي تُستعار. على سبيل المثال، في قرض USDC، يجب أن تكون المدفوعات الرئيسية والفائدة المدفوعة بالـ USDC، وهكذا. بالإضافة إلى ذلك، يمكن أن يكون القرض متاحًا طوال الوقت الذي يحتاجه المقترض، ولا توجد جداول زمنية محددة لمواعيد سداد الأصول الرئيسية والفائدة؛ يحرر المستخدمون لسداد ديونهم بأي تردد أو مبلغ يرغبون فيه. ومع ذلك، تتراكم الفوائد على جميع القروض بناءً على مبلغ الاقتراض الباقي، والذي، جنبًا إلى جنب مع التقلب في قيمة الضمانات والأصول المستعارة النسبية، يؤثر على عامل الصحة لديونهم.
العامل الصحي هو مقياس لمخاطر تصفية المقترض. وهي مشتقة من معايير ضمانات المقترض والأصول المقترضة باستخدام قيمة الأصول المقترضة بالإضافة إلى الفائدة المستحقة بالنسبة لقيمة ضمان المقترض. هذا اعتبار مهم في سياق اقتراض وإقراض العملات المشفرة مع تقلبات الأسعار المتقلبة حيث يمكن تصفية المقترض إذا انهارت قيمة ضماناته بالنسبة للأصل المقترض ؛ ولكن يمكن أيضا تصفيتها إذا زادت قيمة أصولها المقترضة مقابل ضماناتها. في كلا السيناريوهين ، لا تكون قيمة الضمان كافية للحفاظ على القرض مضمونا بشكل كاف. بالنسبة لمعظم التطبيقات ، يؤدي العامل الصحي 0 أو 1 إلى التصفية. يسلط الجدول أدناه الضوء على كيفية حساب Aave و MarginFi لصحة القرض.
يتم احتساب العائد الذي يتم كسبه بشكل أصلي و/ أو من خلال APR توريد التطبيق الإقراض على الأصول الضمانية في قيمتها. على سبيل المثال، تستفيد قيمة الضمان stETH للمستخدم من العائد على الرهان الذي يتم الاستيلاء عليه بشكل أصلي من قبل الرمز السائل للرهان (LST) بالإضافة إلى APY توريد القدر الذي تأتي منه المدفوعات بالفائدة المرتبطة بـ stETH المستعار. يمكن أن يساعد هذا في الحفاظ على قيمة الضمان أكثر ارتفاعًا مقابل الأصول المستعارة وإدخال عنصر كفاءة رأس المال لضمانات المستخدمين.

التصفيات
يتم تصفية ضمانات المقترضين في حال تدهور ديونهم وتحقيق عامل الصحة لديهم نقطة التصفية. يوضح ما يلي كيفية عمل تصفيات بشكل عام في تطبيقات الاقتراض ديفي.
- بروتوكول الإقراض يحتوي على 1 مليون دولار من USDC تم إيداعها عليه. المقترض يرغب في استخدام إيثيريومه الخامل لاقتراض بعض من الـ USDC الموفرة للتطبيق. في هذا المثال، يحتوي التطبيق على حد أقصى لنسبة القروض إلى القيمة الإجمالية (LTV) تبلغ 75%، وعتبة السيولة تبلغ 80% وعقوبة السيولة تبلغ 10%. استنادًا إلى هذه التفاصيل، يقوم المستخدم بالاقتراض 90,000 دولار من التطبيق باستخدام 120,000 دولار من إيثيريومه كضمان، ممثلًا نسبة LTV بنسبة 75%. يترك هذا 910,000 دولار من الـ USDC المتبقية على التطبيق و 90,000 دولار من القروض الكاملة المستحقة، مع 120,000 دولار من إيثيريوم تم إيداعها من قبل المقترض.
- ينخفض سعر USDC للـ ETH مما يؤدي إلى انخفاض قيمة التحت رهن للمستخدم إلى 112،500 USDC والوصول إلى عتبة التصفية بنسبة 80٪. يؤدي هذا إلى تشغيل عملية التصفية، محولاً حقوق ملكية التحت رهن للمستخدم إلى تطبيق الإقراض.
- ثم يفتح التطبيق 112،500 دولار من ETH للمسائلي الذي يشتريها بمقابل 101،250 دولار، حيث يمثل الفارق عقوبة التصفية بنسبة 10٪ المسندة للضمانات ETH. بعد هذه النقطة، يتم إزالة ضمان ETH للمستخدم من التطبيق وتوزيعه للمسائلي، ويتم إضافة عائدات التصفية إلى الرصيد البالغ 910،000 دولار من التطبيق. يتم بذل هذا جهدًا لسداد الدين المستحق، مما يجعل المقرضين كاملين، ويزيل الضمان المقابل من التطبيق. يحتفظ المستخدم الذي اقترض الـ 90،000 دولار بمبلغ القرض الأصلي.
- في النهاية هناك 1,011,250 USDC على التطبيق (1,000,000 USDC تم إيداعها أولاً - 90,000 USDC تم استعارتها + 101,250 USDC من عائدات عملية التصفية) و X - 120,000 USDC بقيمة ETH منذ تم بيع ضمانات المقترض إلى المصفي.
يرجى ملاحظة، يفترض هذا المثال أنه تم تصفية 100% من الضمان الخاص بالمستعير وتم سداد 100% من قرضه لتبسيط الشرح. بعض التطبيقات لا تسمح بذلك وتضع حدًا أعلى لمقدار القرض الذي يمكن سداده في حدث تصفية واحد. بالإضافة إلى ذلك، بعض التطبيقات لا تدعي ملكية الضمان قبل التصفية، مما يسمح للمصفين بشراء ضمان المستخدم مباشرة في سوق مفتوح عند تضرر القرض.
وسائل بديلة للائتمان على السلسلة
تطبيقات الإقراض ليست الوحيدة المتاحة للحصول على الائتمان الرقمي. تقدم عملات stablecoins ومنصات dexes للمستخدمين طرقًا بديلة للحصول على ائتمان لأغراض عدة.
موقف الديون الرهنية للعملات المستقرة
موقف الديون الرهنية (CDP) يمتدّ مُصدرو العملات المستقرة الائتمان من خلال آليات مشابهة لتلك الموجودة في تطبيقات الإقراض، مما يمنح المستخدمين القدرة على سحب السيولة على رؤوس أموالهم الخاملة. مثل القروض من خلال تطبيقات الإقراض، يُحتسب مخاطر المُقترض من العملة المستقرة CDP أيضًا بناءً على أصوله الرهنية. بدلاً من خدمة المقترضين بالأصول المودعة بالفعل من قبل المستخدمين، يقومون بطباعة أصل اصطناعي، عادةً عملات مستقرة بالدولار الأمريكي، ضد الرهون المقدمة. يُنشئ هذا أصلًا مدعومًا بشكل فعال من قيمة الدين الذي تمت أخذه من موردي الرهن. يُسلط الرسم البياني أدناه الضوء على الاختلافات في كيفية تمديد الائتمان من خلال العملات المستقرة CDP وتطبيقات الإقراض:

يعد USDS من شركة Sky وDAI وGHO من Aave أمثلة على العملات المستقرة CDP. تحكم المعايير التي تنطبق على والإجراءات المحيطة بالإقراض غير المركزي في صدور عملة GHO المستقرة من Aave. يستخدم التطبيق حمامات الضمان والتسميات وبنية السوق القائمة للإقراض لإصدار وحدات GHO جديدة مقابل ضمان المستخدمين المقترضين. من ناحية أخرى، توجد Sky فقط لإصدار عملاتها المستقرة CDP. وعلى هذا النحو، تختلف آلياتها ومعاييرها عن تلك المتعلقة بـ GHO والإقراض غير المركزي ككل في بعض المجالات.
ما يلي بعض مكونات عملات CDP الثابتة التي تتداخل مع تطبيقات الإقراض في DeFi:
- حد التصفية - الدين الذي يدعم عملات مستقرة CDP يحتفظ بحدود تصفية مماثلة لتلك الموجودة في الإقراض في مجال العملات الرقمية. الفرق الرئيسي هو أن الحدود في سياقها تمثل معدل الترتيب الحد الأدنى للعملة المستقرة لأصل رهن معين. عند تجاوز هذا المعدل الأدنى، يتم تصفية رهن المستخدمين بطريقة مماثلة لذلك في الإقراض في مجال العملات الرقمية.
- عقوبة التصفية - عقوبة التصفية المرتبطة بتصفية ضمانات العملة المستقرة CDP تشبه تماما عقوبة تصفية إقراض DeFi. تستخدم بعض العملات المستقرة CDP ، مثل Sky ، نظام مزاد لتصفية الضمانات حيث يقوم المصفون بالمزايدة بشكل دوري على ضمانات المدينين. وينتج عن ذلك أن تكون غرامة التصفية الفعلية (الخصم الذي يشترى له الضمانات) أكبر من المعدل الذي حدده البروتوكول في بعض الحالات.
- معدل الفائدة على الاقتراض - على عكس أسعار الاقتراض في التطبيقات التقليدية للقرض اللامركزي التي تخضع لتقلبات عالية وتحدد بواسطة السيولة، فإن أسعار القرض للعملات المستقرة CDP أكثر ثباتًا وتحددها عملية حوكمة الشركة الناشرة. يقوم الناشرون بتحديث الأسعار بشكل دوري بما يتطلبه التغير في السوق. عامل تمييز آخر مع بعض العملات المستقرة CDP هو أن معدل الفائدة على الاقتراض يتم تحديده بواسطة الأصل المرهون بدلاً من تطبيقه عالمياً على الأصل الاصطناعي الصادر. هذا تدبير تعويض للمخاطر يتيح للناشر كسب إيرادات أعلى على الأصول المرهونة التي يعتبرها أكثر خطورة. كما هو الحال في قرض اللامركزي، يقوم المستخدم المقترض بسداد ديونه بالأصل المستقر المقترض (عملة مستقرة CDP). يشير Sky إلى معدل الفائدة على الاقتراض باسم "رسوم الاستقرار."
- سقف الدين - تحدد الحدود العليا لإصدار عملات استقرار CDP لـالخزائن” و “facilitators" التي يتم إصدارها من خلالها. الحدود العليا الموضوعة عليها تعادل حدود الاقتراض في طلبات إقراض DeFi وتخدم نفس الغرض مثل أدوات السيولة وتخفيف مخاطر الإعسار.
ما يلي بعض مكونات عملات CDP المستقرة التي تختلف عن تطبيقات الإقراض في ديفاي.
- معدل الفائدة على العرض - لا تقدم مصدر ثابت للعملة المشفرة معدلًا عائدًا على جانب المستخدم على الضمان الخاص بهم نظرًا لأن الأصول التي يُقرضونها هي صناعية وتم إنشاؤها بواسطة المصدر في وقت إعطاء القرض. ومع ذلك، يمكن للمستخدمين لا يزالون يحصلون على العائد المحلي الناتج عن أصول الضمان الخاصة بهم (على سبيل المثال، عائد الرهان من stETH). في حالة عملة مستقرة GHO لـ Aave، يمكن للمستخدمين لا يزالوا يكسبون عائد على العرض على الضمان الخاص بهم حيث يقوم التطبيق بإقراضه بنشاط.
- الحدود الإمدادات - لا يوجد حد لكمية الودائع التي يمكن للمستخدمين إيداعها مقابل كمية العملة المستقرة التي يقترضونها في بعض الحالات؛ يمكنهم تغطية ديونهم بمقدار أي يرونه مناسبًا. في حالة Aave، تنطبق الحدود الإمدادات وجميع المعلمات الأخرى التي تحكم أصول الضمان على عملة GHO المستقرة.
- عامل الاحتياطي - لا تحمل العملات المستقرة CDP عاملاً احتياطيًا. تذهب جميع العائدات التي تولدها الفوائد المدفوعة إلى الشركة المصدرة التي تمتلك تقديرًا في إعادة توزيع الدخل المولد. هذا هو الحال أيضًا بالنسبة إلى Aave بالنسبة إلى عملتها المستقرة CDP. يمكن للشركة المصدرة توجيه هذه العوائد مرة أخرى إلى المستخدمين كعائد على العملة المستقرة CDP وإعادة شراء رمز الحوكمة إذا اختارت ذلك.
- حرق الديون المسددة - على عكس تطبيقات الإقراض التي تقدم ودائع الموردين للمقترضين ، يقوم مصدرو العملات المستقرة CDP بسك الأصل المقترض. نتيجة لذلك ، عندما يسدد المقترضون ديونهم ، يتم حرق الرموز المسددة وإزالتها من العرض المتداول.
أنظمة البشكل الدائم
تعمل Perps dexes بشكل مشابه لتطبيقات الإقراض على السلسلة ، حيث تقدم الائتمان للمستخدمين من خلال مجمعات السيولة التي تم إنشاؤها بواسطة ودائع LP. ومع ذلك ، فإنها تعمل على تقديم الائتمان للمستخدمين لغرض وحيد هو التداول باستخدام الرافعة المالية onchain. مثل تطبيقات الإقراض ، يسهل التطبيق تخصيص ودائع LP للمتداولين الذين يمكنهم بعد ذلك استخدام الأموال المقترضة لتضخيم مراكز التداول الخاصة بهم. ثم يقوم المتداولون الذين يستخدمون الأموال المقترضة بسداد التمويل إلى التطبيق و LPs الخاصة به على مدار مدة تداولهم.
تتجلى أوجه القصور داخل perps dexes بشكل مشابه لتطبيقات الإقراض ، مع بعض الاختلافات. مثل تطبيقات الإقراض ، يؤدي عدم سيولة perps dexes ، والتي تتميز بارتفاع الطلب على الرافعة المالية وانخفاض العرض (ودائع LP) ، إلى ارتفاع معدلات التمويل. بشكل فريد ، يمكن أن يؤدي عدم سيولة perps dexes أيضا إلى تأثيرات سعرية صعودية أو هبوطية على التداولات اعتمادا على ما إذا كان المتداول يقوم بالشراء أو البيع. في هذه الحالات ، يتم ملء المتداولين بأسعار أعلى من السعر الفوري للأصل الذي يتداولونه عند الشراء ، وأقل عند البيع ، مما قد يؤثر سلبا على أداء التجارة.
يظهر الرسم البياني أدناه كيف تعمل منصات العقود الآجلة ديكس من مستوى عالٍ.

مخاطر التمويل اللامركزي
هناك عدد من المخاطر المرتبطة بتطبيقات الإقراض على السلسلة والتي تؤدي في المقام الأول إلى خسارة مؤقتة أو دائمة للأموال. من الأفضل تصنيفها على أنها مخاطر التكنولوجيا وتصميم البروتوكول ومخاطر الإدارة. تتعلق المخاطر في هذه المجموعات على وجه التحديد بتطبيقات الإقراض نفسها ومعاييرها وهي بالإضافة إلى مخاطر الأصول المقرضة والمقترضة ، والشبكات التي تعيش عليها التطبيقات ، والنشاط العام للإقراض والاقتراض.
هذه المخاطر الإضافية غير مشمولة بالتفصيل أدناه ولكنها تشمل على الأقل السيولة على السلسلة، مستوى السيطرة الذي يمتلكه المصدرون، ونزاهة الكود الذي يعتمد عليه الأصول المقترضة والمقرضة؛ الرقابة والتوقف على الأقل على مستوى الشبكة؛ والتصفية، وإعادة الرهن، ومخاطر توفر السيولة للمقترض والمقرض توجد في النشاط العام للإقراض والاقتراض. يهدف الطابع السلسلي لتطبيقات الإقراض إلى التخفيف من بعض المخاطر المرتبطة بنشاط الإقراض والاقتراض التي توجد عادة خارج السلسلة، مع ذلك.
مخاطر التكنولوجيا
يتعلق المخاطر التكنولوجية لتطبيقات الإقراض والتطبيقات البديلة للائتمان على السلسلة الرئيسية في المقام الأول باستغلال العقود الذكية وتلاعب الموردين أو عدم دقة البيانات التي يمكن أن تؤدي إلى فقدان الأموال. يحمي سلامة العقود الذكية الواقعة في أسفل تطبيق مباشرة ويحكم حركة الأموال. يمكن أن يؤدي الكود السيئ الصياغة و/أو عدم فحصه إلى فقدان الأموال في حال تم استغلال عقد ذكي. في معظم الحالات، يصعب استعادة الأموال المفقودة بسبب استغلال العقود الذكية. فيما يلي أمثلة على العقود الذكية في بعض تطبيقات الإقراض التي يمكن استغلالها:
- عقود التجمع - هذه العقود هي العقود الأساسية التي تواجه المستخدمين والتي تستضيف الودائع التي يتم سحب السيولة منها من قبل المقترضين. تسمح استغلالات هذه العقود للمشغلين الخبيثين بسحب أموال المستخدمين على تطبيق الإقراض.
- عقود إصدار الرموز - هذه العقود تصدر رموز القسيمة التي يتم استخدامها للمطالبة بالودائع والتحاسب عن الديون المعلقة. يمكن لاستغلال هذه العقود أن يسمح للأطراف الخبيثة بالمطالبة بالأصول المودعة على التطبيقات الإقراضية التي لا تمتلكها أو استغلال الفجوات بين الرموز الضمانية والديون. هكذا تعمل إيولر فاينانس مهاجمتمكن من سرقة 197 مليون دولار من الودائع الخاصة بالمستخدمين.
- عقود أذونات العمليات - هذه العقود تفوض الأذونات إلى العناوين التي تتفاعل مع تطبيق الإقراض. يمكن أن تمنح استغلالات هذه العقود للممثلين الخبيثين السيطرة غير المعتمدة على وظائف التطبيق.
والتقنيات الخارجية التي تعتمد عليها تطبيقات الإقراض، وتحديدا البوابات، تضيف نقاط ضعف وفشل يمكن أن تؤدي إلى فقدان الأموال. البوابات، التي تغذي البيانات السعرية وغيرها في تطبيقات الإقراض، تلعب دورًا أساسيًا في تتبع قيم الاقتراض والضمانات، وقيم الأصول سعرية في حالة perps dexes. يمكن أن تؤدي تلاعبات بتغذيات أسعار البوابات أو عدم دقة البيانات التي تمرونها إلى تطبيقات الإقراض إلى التصفية وفقدان أموال المستخدمين. وكان هذا هو الحالمؤخرافي سوق مورفو عند حدوث خطأ عشري في أوراقل، تم تحديد سعر أحد الرموز في بركة الإقراض بشكل زائد. هذا الأمر سمح للمستخدم بتقديم فقط 350 دولارًا من الضمان لاقتراض 230،000 دولار أمريكي.
تصميم البروتوكول وإدارة مخاطر الإدارة
تتعلق مخاطر تصميم وإدارة البروتوكول ب 1) المعلمات التي تحكم نشاط الإقراض والاقتراض ، 2) تعقيد التطبيق ، و 3) درجة سيطرة المطورين وفرق الإدارة على التطبيق. النقطة الأولى حصرية لتطبيقات الإقراض ، حيث أن المعلمات خاصة بالخدمات التي تقدمها. بينما يمكن تطبيق النقطتين الثانية والثالثة على أي تطبيق onchain.
وتستخدم بارامترات الإقراض والاقتراض، والتقييمات الأساسية التي تتألف منها، كآليات موازنة لتحقيق أقصى قدر من الكفاءة الرأسمالية للأصول المودعة مع السماح بالأداء السلس للتطبيقات، مثل عمليات التصفية وسحب المستخدمين. ونتيجة لذلك، يمكن أن تؤدي الحسابات الخاطئة في المعايير وتقييمات مخاطر الأصول إلى نقص السيولة، وتراكم الديون المعدومة، وتسلسل التصفية السامة، حيث تؤدي تصفية ضمانات المستخدمين إلى تفاقم القيمة طويلة الأجل الخاصة بهم، داخل تطبيقات الإقراض. يمكن أن يؤدي ذلك إلى تصفية سابقة لأوانها أو متأخرة ، أو عدم قدرة التطبيق على تصفية ضمانات المستخدم ، أو عدم قدرة المستخدمين على سحب أصولهم ، أو تراكم الديون غير المضمونة أو غير المدعومة. في حين أنه من الضروري أن تكون المعلمات مصممة بدقة وليست فضفاضة للغاية ، إذا كانت المعلمات مقيدة للغاية ، فقد تترك تطبيقا بمنتج غير تنافسي أو لا يزيد المستخدمون من قيمة أصولهم.
تعقيد وظائف التطبيق والخدمات التي يقدمها يضيف نقاط خطر إضافية. بينما يتفاقم هذا الخطر بسبب العقود الذكية السيئة البنية وغير المدققة، يقدم تطبيق معقد للغاية مزيدًا من نقاط الفشل المحتملة والتلاعب. كما يسمح بالسماح للمهاجمين باستخدام مجالات مختلفة من التطبيق ضد الآخرين لتنفيذ الهجمات، كما كان الحال مع شركة Platypus Finance في فبراير 2023استغلال. في هذه الحالة المحددة، تمكن المهاجم من استخدام رموز Platypus AMM LP (رموز توفير سيولة صانع السوق الآلي) لمهاجمة العملة المستقرة USP التي أصدرتها Platypus.
أخيرًا، يؤثر درجة السيطرة التي يمتلكها المطورون وفرق الإدارة على التطبيقات ومعلماتها مباشرة على أموال المستخدمين. إن التخلي عن السيطرة على التطبيق لعدد قليل من الكيانات يسمح بإجراء تغييرات من جانب واحد، بدلاً من المصلحة العامة لقاعدة مستخدمي التطبيق بشكل أوسع. يمكن أن تعمل التغييرات المفاجئة على المعلمات أو الترقيات إلى إصدارات تطبيق جديدة ضد أموال المستخدمين في أفضل الحالات، وتؤدي في أسوأ الحالات إلى فقدان كامل أو عدم إمكانية الوصول إلى الأصول.
مخاطر الإقراض التي تخففها تطبيقات Onchain
بينما يقدم الطبيعة الرقمية لتطبيقات الاقتراض مخاطر فريدة للإقراض والاقتراض، فإن حكمها القائم على الشروط المحددة مسبقاً وشفافيته يخفف بعض مخاطر نظيرها الخارج عن السلسلة.
تسمح الحوكمة القائمة على الشروط المحددة مسبقا لتطبيقات الإقراض للمقرضين والمقترضين بإدارة المخاطر بشكل أفضل. ويرجع ذلك إلى حقيقة أن جميع المعلمات التي تحكم أصولها المقترضة والمقترضة معروفة مسبقا وأن قيم المعلمات غير الثابتة ، مثل معدلات الاقتراض والعرض ، يتم حسابها على أساس if x ثم y حيث تعرف y دائما. مع معرفة النتائج حول المتغيرات ، يحتاج المقرضون والمقترضون فقط إلى وضع افتراضات حول قوى الإدخال التي تقود التغييرات في المعلمة المرصودة.
إن شفافية البلوكشينات العامة تتيح للمقرضين والمقترضين تقدير هذه القوى من خلال بيانات صحيحة يمكن التحقق منها. على سبيل المثال، تسمح البيانات على السلسلة للتدقيق في جدارة المقترض، والرافعة المالية، وأصول الضمان وقيمها، وأكثر من ذلك. لذلك، تحت أي ظرف، يعرف المقترضون والمقرضون دائمًا المعايير التي تحكم أصولهم ولديهم البيانات الضرورية لفهم كيفية تأثير مواقفهم.
يستفيد سمة الشفافية في أسواق الإقراض على السلسلة العابرة أيضًا أولئك الذين ليس لديهم تعرض لها. يمكن لمشاركي السوق استخدام هذه التطبيقات والبيانات التي تنتجها لفهم اتجاهات السوق. ويشمل ذلك، على سبيل المثال لا الحصر، القدرة على تحديد مدى تأثر السوق بالرافعة المالية، وكم تقترب المراكز الكبيرة من التصفية، وكيف يمكن أن تؤثر تكاليف الاقتراض لأصول معينة على فائدتها.
من يستخدم الإقراض على السلسلة الرقمية وكيف يستفيدون منه؟
المستخدمون الثلاثة الأساسيون لتطبيقات الإقراض والائتمان على السلسلة القائمة تشمل:
الأفراد: يشمل الأشخاص، الذين يمكن أن يكونوا تجار تجزئة حتى أصحاب الثروات الفائقة العالية (UHNWI)، الذين يمتلكون أصولًا على السلسلة الرقمية ويحتاجون إلى الوصول إلى السيولة أو كسب العائد. يسعون وراء السيولة على أصولهم للمشاركة في الزراعة وفرص الاستثمار، والوصول إلى الأموال للحاجات الشخصية وحالات الطوارئ، وتحقيق عائد من الأصول الخاملة التي يمتلكونها. الفائدة الرئيسية للإقراض على السلسلة الرقمية للأفراد تتضمن الوصول غير المميز إلى رأس المال والقدرة على كسب العائد.
الشركات: تشمل الشركات والكيانات التجارية الأخرى. يستخدمون تطبيقات الإقراض على السلسلة للحصول على سيولة فورية على مدار 24/7 لتمويل عملياتهم التجارية الجارية والحفاظ على سيولة نقدية صحية. الفائدة للشركات التي تشعر بالراحة بتحمل مخاطر السلسلة تتضمن شفافية الأموال وخيارات تمويل رخيصة نسبياً.
مشغلو الخزانة: محترفون يديرون الاحتياطيات المالية للمؤسسات. يركزون على تحقيق عائد من الأصول الخاملة، سواء كانوا يديرون منظمات مجتمعية لامركزية (DAOs) أو حسابات خزانة تقليدية خارج السلسلة. يتضمن الفائدة لهذه الكيانات تنويع العائد والقدرة على كسب عائد على معظم الأصول الموجودة على السلسلة.
استنتاج
تمثل تطور أسواق إقراض العملات الرقمية معلمًا بارزًا في نضوج البنية التحتية للأصول الرقمية. كما هو موضح في هذا التقرير، ظهرت قدرات الإقراض والاقتراض كركيزة أساسية في كل من تمويل العملات الرقمية المركزي واللامركزي، مما خلق آليات سوقية أساسية توازي الأنظمة المالية التقليدية بينما تقدم ابتكارات تكنولوجية جديدة.
يؤكد سيطرة بروتوكولات الإقراض داخل النظام البيئي للتمويل اللامركزي على أهمية هذه الخدمات الأساسية للاقتصاد الرقمي الأوسع نطاقًا. لقد أنشأت طبيعة البنية التحتية للإقراض على السلسلة الذاتية الخوارزمية نموذجًا جديدًا لعمليات السوق، نموذج يعمل بشكل مستمر وشفاف بينما ينفذ إدارة مخاطر برمجية. تمثل هذه الإطار التكنولوجي تحولًا معنويًا عن الأنظمة المالية التقليدية، مما قد يوفر كفاءة محسنة وتقليلًا لمخاطر الوسيط.
نظرًا للأمام، يبدو أن سوق إقراض العملات الرقمية مستعد لمرحلة نمو جديدة، تتميز بأطر إدارة المخاطر المحسنة، ومشاركة مؤسسية أكبر، وإرشادات تنظيمية أوضح. يشير التقارب بين الخبرة المالية التقليدية والابتكار القائم على تقنية البلوكشين إلى مستقبل تصبح فيه خدمات إقراض العملات الرقمية أكثر تطورًا وموثوقية، مع الحفاظ على الفوائد الفريدة لتقنية البلوكشين. مع استمرار نضوج القطاع، قد يكون بمثابة جسر بين التمويل التقليدي ونظام الأصول الرقمية الناشئ، مما يسهل تبني خدمات التمويل القائمة على العملات الرقمية بشكل أوسع.
تنصيح:
تم نقل هذه المقالة من [Cryptoمجرة]. جميع حقوق النشر ملك للمؤلف الأصلي [Zack Pokorny]. إذا كانت هناك اعتراضات على هذه الإعادة طباعتها، يرجى الاتصال بالتعلم Gateالفريق، وسيتعاملون معه بسرعة.
إخلاء المسؤولية عن الضرر: الآراء والآراء الواردة في هذه المقالة تعبر فقط عن رأي الكاتب ولا تشكل أي نصيحة استثمارية.
يتم إجراء ترجمات المقال إلى لغات أخرى من قبل فريق Gate Learn. ما لم يذكر غير ذلك، فإن نسخ أو توزيع أو نسخ المقالات المترجمة محظور.
المقالات ذات الصلة

كل ما تريد معرفته عن Blockchain

ما هو DYDx؟ كل ما تريد معرفته عن DYDX

تاريخ موجز لعمليات الإنزال الجوي واستراتيجيات مكافحة السيبيل: حول تقاليد ومستقبل ثقافة الركوب الحر

ما هو يونيسواب؟

الضجة الأخيرة حول العديد من روبوتات " Crypto ": اتجاه عابر أم حدود استثمارية جديدة؟
